Case Study
Introduction
Chronos is an event-capturing framework for greenfield applications, and is built using NodeJS, Apache Kafka, TimescaleDB, and PipelineDB. It allows developers to easily capture and store user events that happen on the client side, and then perform data exploration on the captured events. At its core, Chronos is an event streaming system that allows developers to extend its capabilities through the Kafka ecosystem. Further, Chronos is deployed using Docker and comes with a CLI that abstracts the difficulties in installing and running the system.
This case study will begin by describing what event data is and how it contrasts from entity data. Next, we will define what a greenfield application is and review some of the existing solutions for this area and what some problems there are in using these systems. Lastly, we will describe how we went about building Chronos in order to solve these problems and how we overcame the challenges that presented themselves along the way.
What is Event Data?
Event Data vs Entity Data
Very often, when we speak of "data" in an application we generally tend to think of data that resides in a database that is modeled after real world entities. This may be a shopping cart, a bank account, a character in an online video game, etc. In each of these cases, we are dealing with **entity data**, or data that describes the current state of some entity. This type of data is generally what comes to mind when we think of SQL and Relational Databases.
| Column Name | Value |
|---|---|
| id | 327 |
| account_name | Bugman27 |
| imabug@foo.bar | |
| account_status | active |
| name | Franz Kafka |
| age | 53 |
Typical example of entity data
However, there is an emerging realization that while we generally tend to think of applications as tracking entity data, there is also a constantly occuring stream of events. An event in this case is any action that occurs in an application. Examples could be a user clicking on a link, submitting a payment, creating a character, landing on a page, etc.
{
  "eventType": "pageview",
  "timestamp": "2018 20:29:48 GMT-0600",
  "page URL": "www.example.com",
  "pageTitle": "Example Title",
  "user": {
    "userId": 7689476946,
     "userCountry": "USA",
     "userLanguage": "en-us",
     "userAgent": "Chrome",
     ...
}
Example of a pageview event as a JSON object
As such, event data is data that models each of these events. Unlike entity data which is core to the business logic of an application, event data is a kind of metadata, or data about data, which describes how an application is being used, and is usually not central to its business logic. In this case, if entity data is a noun which carries around state, then event data is a verb which describes an action.
Since event data describes how an application is being used, capturing and analyzing this data provides a major competitive advantage since it can be used to positively iterate on a product and increase insights.[1] However, if a developer wants to track event data, then unlike entity data, all the events would have to be stored since it is with the total set of events that one can analyze the data and draw conclusions. In other words, events are treated as immutable and are never updated and rarely deleted. The following table maps out the differences in this model between event and entity data thus far:[2]
| Entity Data | Event Data |
|---|---|
| Strict schema | Flexible schema |
| Normalized | Denormalized |
| Shorter | Wider |
| Describes nouns | Describes verbs |
| Describes now | Describes trends over time |
| Updates | Appends |
| O(N) | O(N * K) |
While this is a good first attempt to model events, the key problem with ending here is that while there is definitely a legitimate distinction between event data and entity data, the two cannot be completely partitioned into unrelated categories. To understand why this is, we need to discuss the "theory of streams and tables" as concevied by Martin Kleppmann, Jay Kreps, and Tyler Akidau.
Streams and Tables
To start with, we'll need some working definitions of what streams and tables are. To borrow from Akidau, a stream is "[a]n element-by-element view of the evolution of a dataset over time."[3] Streams have traditionally been processed by streaming systems that are designed to handle unbounded (infinite) datasets. A table is "[a] holistic view of a dataset at a specific point in time"[3] and is traditionally handled within relational databases (i.e. SQL). We can expand these definitions by saying that streams are data that are in motion, while tables are data that are at rest.
Staying with tables for a moment, it's worth remembering that the underlying data structure for many databases is a log, more specifically one that is append-only. As each transaction takes place for a particular entity, they are recorded to the log. The log, then, can be seen as a kind of stream of data which can be used to re-create the state of a table within our database. More broadly speaking, the aggregation of a stream will give us a table.

The inverse of this relationship is that streams are created from tables as a kind of change-log for the table. In other words, if we look at the changes that occur on a particular entity over time, we end up with a stream of data.

To bring this back to event data and entity data: if we were to write all the event data within our application onto a log, then we would be able to re-create the state of any entity data that we needed. In other words, rather than being two separate kinds of data, event data are the individual data points that make up the stream of our application, while entity data are the aggregated snapshots of our stream of event data.
In this respect, though databases are often thought of as the "source of truth" in an application, they actually contain just a set of aggregations of event data at a particular point in time. It is the log that holds the event data that is the actual source of truth of our application since it contains the fundamental building blocks to recreate the state of the application.
(image)
Given all this, it should be clear that there are several good reasons for capturing event data:
- Event data provide rich information that can be used to see how users are using your application
- Event data can validate business logic or be used to form new strategies
- Event data are the fundamental building blocks of the state of an application
The main difficulty in capturing and using event data is that since for so long they've been seen to exist implicitly in an application they don't have a proper place within an application's data architecture. Further, since events are constantly happening in real time, any system for capturing and storing event data needs to be able to map to this stream of events and store data in an apropos way.
Manual Implementation
First, we should explore how you would go about implementing an event capturing system manually. The first question you might ask yourself is “what kind of database should I use to store my event data?” When implementing your storage system, there are three considerations for greenfield applications:
- How can you store event data in a way that is efficient for a write heavy application?
- How can you make data exploration easy for a developer?
- How can you make it space effective?
Database Selection
The first concern, “how can you store data in a way that is efficient for write heavy application,” inevitably leads to the SQL vs NoSQL question. Most streaming systems used for analytics utilize NoSQL. Reasons include:
- NoSQL performs better in write heavy applications
- The schema of the event data doesn't have to be known in advance, which makes it more flexible
- NoSQL is better at horizontal scaling (sharding) than SQL
- It is harder to scale SQL given the large number of events captured compared to NoSQL
Since you are capturing events for the sake of data exploration, your first instinct may be to use a relational database. SQL is a powerful declarative language that, even according to analytics companies such as Keen IO (who use Cassandra), is still the bar none when it comes to exploring data. However, you’ll quickly notice a couple of drawbacks when using a relational database.
The chief difficulty with using SQL for event data is that since you are storing data for each action taken by a user, the eventual dataset in the database will be massive, so much so that it cannot reside just in memory and thus must persist on the disk as well. This also means that the indexes must reside on the disk as well, and thus any time you will need to update the data structure of our indexes, there will be quite a bit of disk I/O, which degrades performance. This shouldn’t come as a surprise; since you (usually) do not want to delete raw event data, that means that the primary writes to a database are inserts instead of updates (the latter being more common in an OLTP database).
Another difficulty when using SQL for storing event data is that SQL requires each record that is inserted into a table to conformed to a pre-defined schema. While it is possible to change the schema, this would require you to take the database offline in order to make any changes. If you wanted to manually define the events you would like to capture for our greenfield application, then you will also need to take time defining the structure of the tables on the database layer of your pipeline.
What you need, then, is a database that is able to perform well with a write-heavy application where we are constantly appending schema-less data. One option is to use a database whose underlying structure is a Log-structured Merge (LSM) tree, such as a document store (MongoDB) or a columnar database (Cassandra). LSMs are more efficient for large number of writes since they “reduce the cost of making small writes by only performing larger append-only writes to disk” as opposed to in-place writes.[4] In addition to this, these databases shouldn’t require you to define a schema before hand, which means you can change the structure of your event data on the fly without having to rework the back end. This allows for dynamic updating to your data models without coupling us to whatever back end we use.
While many analytics companies use columnar databases to store event data given their ability to analyze large data sets, a document store would suffice for a greenfield application. This is because your event capturing system is single tenant — it is just for your application, and so you don’t expect to need to examine nearly as a large of a dataset as an enterprise event-streaming system.
However, there are certain tradeoffs for choosing a LSM document store, namely that there are higher memory requirements and poor support for secondary indexes, both of which are a consequence of the underlying data-structure. That having been said, since you don’t exactly know what you'll be doing with our event data yet, losing secondary index support is an acceptable tradeoff. Further, a document store will require more memory than a relational database.
Though we are losing the power of the SQL language for data exploration, SQL’s chief difficulty with storing event data really does not make it a viable option since it will degrade far quicker in performance. Thus, for our hypothetical event capturing pipeline, a document store such as MongoDB would be a fine choice.
As you explore your data, you’re eventually going to discover recurring trends in how users interact with your application. If you wanted to track these patterns in “real-time” then you’ll need a way to aggregate the incoming event data into materialized views for analysis. A naive solution would be to set up various chron-jobs that run queries over the database to aggregate data. There are two problems with this approach. First, you will have to run your query against the entire dataset in order to filter it by whatever window of time you wish to use (e.g. last 5 minutes, 1 hour, 3 days, etc). These kinds of queries will become more expensive as our dataset grows. Second, this isn’t actually “real-time” since we are not continuously running a query, but rather just running a new query every so often. For example, if you wanted to know how many unique visitors came to your site within the last hour, at time a your “real-time” view would display one set of information. Until that view was materialized again an hour later at time b, the data would remain the same even though other users have now visited your site. In other words, you would be limiting yourself to set windows instead of sliding windows.
Instead, you could use a stream processor such as Apache Spark that will take the data while it’s still in a stream and aggregate it in whichever way you need. This would also allow you to use sliding windows to materialize actual real-time feedback instead of snapshots on the hour. Lastly, you could also store whichever views you wanted into your database in a new collection.
Code Coupling
Now that you have your database selected, you can continue with the rest of the event-processing pipeline. For the web server and API server, you don’t have to be as too picky. You could use HAProxy for the web layer, and NodeJS as your API server that receives the events sent by the client.
Currently the architecture may look something as follows:
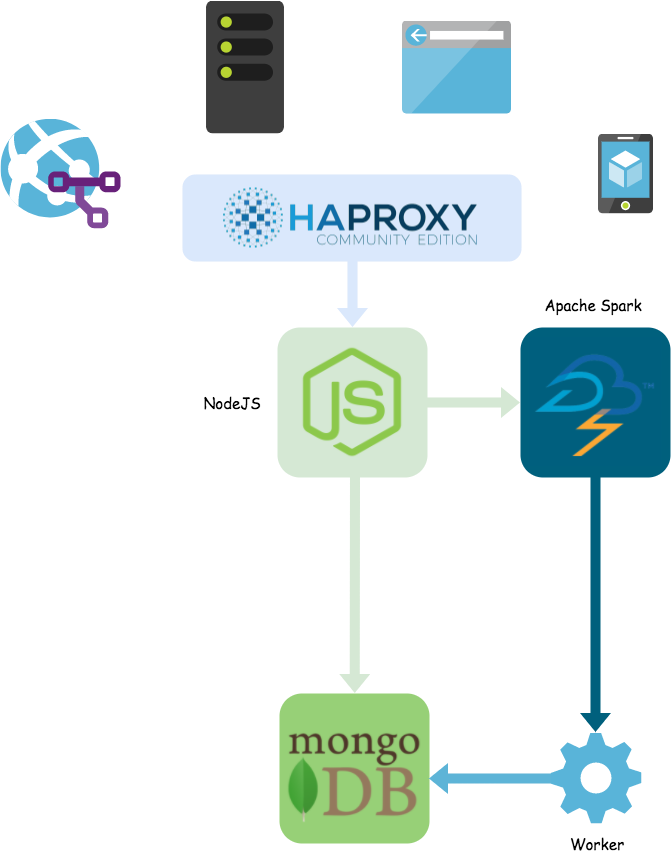
Already it has taken you quite some time to research and set up this architecture. However, you also may start noticing a problem: each piece of your architecture is tightly bound to at least one other piece. This is problematic because if one part goes down it could have a ripple effect throughout the whole system.
This problem will only increase as you continue to develop our event-processing pipeline. As your data exploration continues, you’ll likely find queries that you wanted reported to you on a daily basis, perhaps showing data such as the total number of unique visitors to your application that day, what the peak hours of usage were, the most visited pages, etc. We could run these queries via a chron-job set early in the morning (when user activity is low), and then have a worker send the data off to be e-mailed to us.
Further, since you want your application to be space effective, you likely don’t need to keep any data in MongoDB after some time duration. While you could take data that is older and aggregate it in some way to save on space, you'd also lose all the raw data in doing so. Instead, you could extract the data and compress it down as much as possible and store it on disk to be later sent to a some other service once you've outgrown your own event capturing system. This would require some kind of worker to extract the data from MongoDB and then perform the compression and storage:
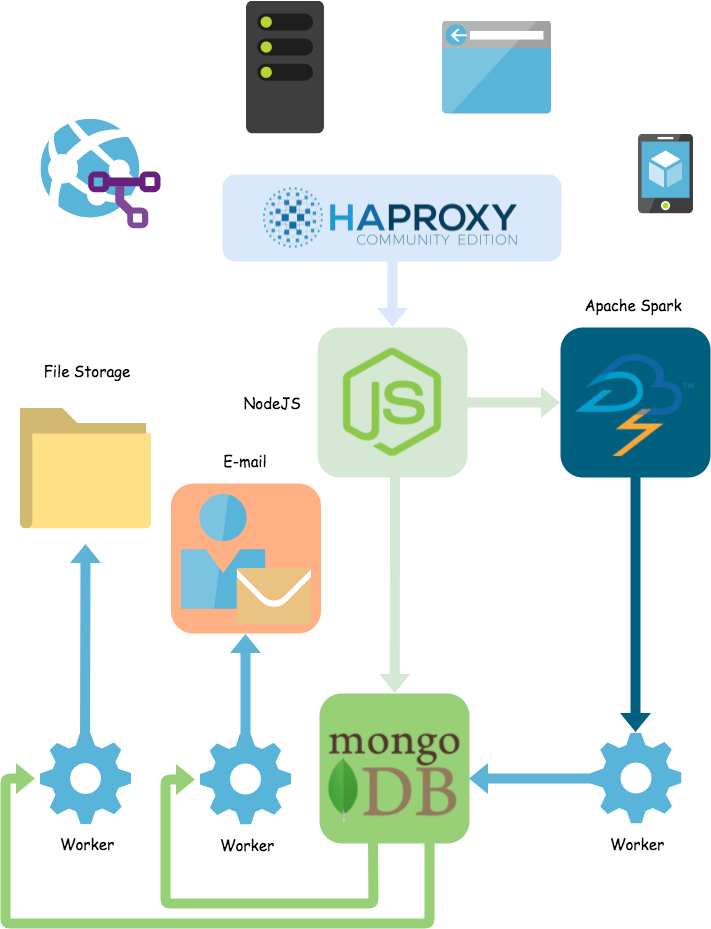
The pieces have become so entwined with one another that to have them communicate might involve a series of workers and other steps that, if any other part of the system fails, could also affect this communication. This problem will just continue to grow as our application does as well.
The way to decouple the pieces of architecture from one another is to use a messaging queue as a central piece which facilitates the communication of the various parts of the system. The messaging queue uses a "Pub/Sub architecture" where producers of data send messages to a topic and consumers of data would read those messages from the same topic. This also modularizes our system so that it is easy to add new producers and consumers as we need them.
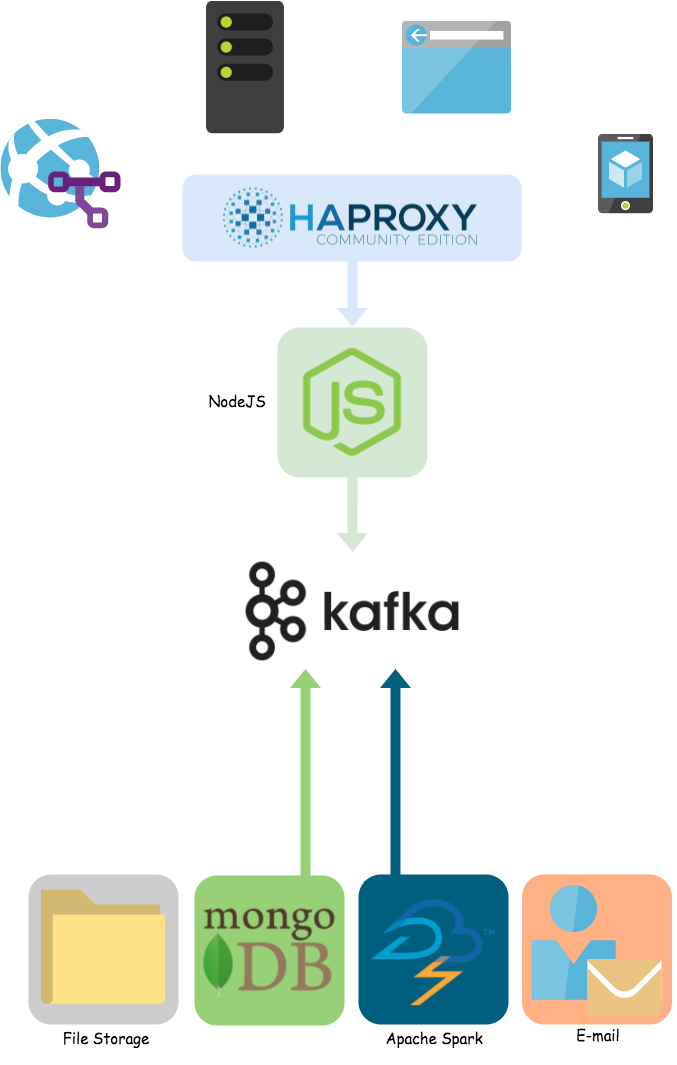
While your streaming system is now complete, you’ve spent a lot of time researching various components, implementing them to work together, and testing them to make sure they work — and this is only on the backend! You haven’t gone and created your event tracking system for the client side yet. It should be clear by now why manually setting this system up for a greenfield application where you aren’t even completely sure how you’ll be using your event data yet is inefficient.
Existing Solutions
Luckily, there are already existing solutions for a developer who wishes to capture, store, and analyze event data. However, many of these solutions are proprietary in nature and while they could be used for greenfield applications, they are better suited for larger or enterprise level applications. With these solutions we generally found the following problems:
- Monetary costs
- Data lives on the proprietary service's servers
- Data may be sampled
- You may not have access to your raw data
- Manual implementation of events to capture
The problems of these drawbacks should be straightforward:
- Since greenfield applications are usually in a prototype or new phase, they likely don't have or want to spend a lot of money on proprietary solutions
- With the growing concern about how people's data is being used, it's always a gamble to have your data hosted on a service's server that you don't have direct access to
- Same problem as #2
- If you can only access data through an API and can never get at the raw data itself, not only does that limit what you can do with the data, but it makes it hard if not impossible to transfer it to another solution
- Since a greenfield application doesn't yet know what events to capture, requiring manual implementation of event capturing is counter-intuitive
Of the various solutions, there were two in particular better suited our use case: Event Hub and Countly Community Edition.
EventHub
One solution for greenfield applications is EventHub, which is an open source event tracking/storage system written in Java. It has some impressive analytical capabilities such as cohort queries, funneling queries, and A/B testing.
To deploy EventHub, our host machine needs to be able to run Java SDK and Maven. The compilation and running is a few short commands as provided on EventHub's README:
# set up proper JAVA_HOME for mac
export JAVA_HOME=$(/usr/libexec/java_home)

git clone https://github.com/Codecademy/EventHub.git
cd EventHub
export EVENT_HUB_DIR=`pwd`
mvn -am -pl web clean package
java -jar web/target/web-1.0-SNAPSHOT.jar
One big drawback of EventHub is that the timestamp is uses for its funnel and chorot queries is based upon processing time, or when the data hits the server, as opposed to event time, or when the event actually occured. EventHub admits as much and even spells out the key problem with this approach:
The direct implication for those assumptions are, first, if the client chose to cache some events locally and sent them later, the timing for those events will be recorded as the server receives them, not when the user made those actions; second, though the server maintains the total ordering of all events, it cannot answer questions like what is the conversion rate for the given funnel between 2pm and 3pm on a given date.
EventHub doesn't track any events out of the box and so all event tracking must be implemented manually. Thankfully, the tracking API is fairly simple to use:
eventHub.track("signup", {
  property_1: 'value1',
  property_2: 'value2'
});
There are two other drawbacks of EventStore worth mentioning: firstly, it uses HawtJournal as journal storage, which uses a Java API for accessing data. While not to demean HawtJournal, it is likely not nearly as well known as SQL or NoSQL databases and thus may make data exploration for a greenfield application quite a nuisence. Secondly, EventHub has been abandoned for 5 years now, so support would likely be totally absent.
Countly Community Edition
Another option is Countly's community edition (open source). Countly allows not only for a quick manual setup on your own server, but also provides a one-click setup option for deploying on Digital Ocean. Further, you can deploy Countly via Docker if that better suits your needs. Once deployed, it is recommended to assign a DNS A record to your Countly server (though this is optional), and you must still configure email delivery so that emails from the server are not caught by spam filters.
Countly’s tracker is a JavaScrpit SDK that tracks the following events automatically:
- sessions
- pageviews (both for tradition websites and single page applications)
- link clicks (both on a link or those on a parent node)
- form submissions
Two other events, mouse clicks and mouse scrolls, are only automatically captured in the enterprise edition, which costs money and is not open source. To use the tracker, you must install the tracker library (which can be done in a variety of ways including CDNs) and generate an APP_KEY by creating a website for tracking on the Countly Dashboard UI. Once this is done, you can set up the tracker configuration within a script tag, as well as manually implement any other event you’d like to capture other than the defaults:
<script type='text/javascript'>

var Countly = Countly || {};
Countly.q = Countly.q || [];

Countly.app_key = "YOUR_APP_KEY";
Countly.url = "https://yourdomain.com";

Countly.q.push(['track_sessions']);
Countly.q.push(['track_pageview']);

// Uncomment the following line to track web heatmaps (Enterprise Edition)
// Countly.q.push(['track_clicks']);

// Uncomment the following line to track web scrollmaps (Enterprise Edition)
// Countly.q.push(['track_scrolls']);

// Load Countly script asynchronously
(function() {
    var cly = document.createElement('script'); cly.type = 'text/javascript';
    cly.async = true;
    // Enter url of script here (see below for other option)
    cly.src = 'https://cdn.jsdelivr.net/npm/countly-sdk-web@latest/lib/countly.min.js';
    cly.onload = function(){Countly.init()};
    var s = document.getElementsByTagName('script')[0]; s.parentNode.insertBefore(cly, s);
})();
</script>
<script type='text/javascript'>
//send event on button click
function clickEvent(ob){
    Countly.q.push(['add_event',{
        key:"asyncButtonClick",
        segmentation: {
            "id": ob.id
        }
    }]);
}
</script>
<input type="button" id="asyncTestButton" onclick="clickEvent(this)" value="Test Button">
Truncated examples from the Countly JavaScript SDK documentation
Since Countly must be deployed on your own server, you have access to all of your data (which is stored in MongoDB). To make querying the database easier, the Countly UI can also use a plugin to explore the database. However, the community edition only stores data in an aggregated format so as to increase the speed of queries and decrease storage space. This means in order to get access to raw data, you must use the enterprise edition. Further, many of the UI features also require an enterprise edition to be used (e.g. automated push notifications, retention, user flows, custom dashboards, etc). Lastly, since Countly doesn’t utilize a modularized architecture, if you ever wanted to expand your Countly server to use other software, you would have to deal with any implementation issues via code coupling, requiring you to have a good grasp on the overall structure of the codebase.
Chronos
Chronos offers a different set of tradeoffs that automates many of the pains of a manual implementation, but allows for control and ownership of an open course solution. Chronos:
- Is open source, and thus free to use
- Keeps data only on the server you host Chronos on
- Will never sample your data
- Provides access to your raw data as well as aggregated views in real-time
- Provides a config file that specifies which events you'd like to capture: everything else is automated
In addition to this, Chronos can visualize any queries over the data. We also wanted to make sure that Chronos would be space efficient since a greenfield application shouldn't be spending lots of money on their own server to collect data.
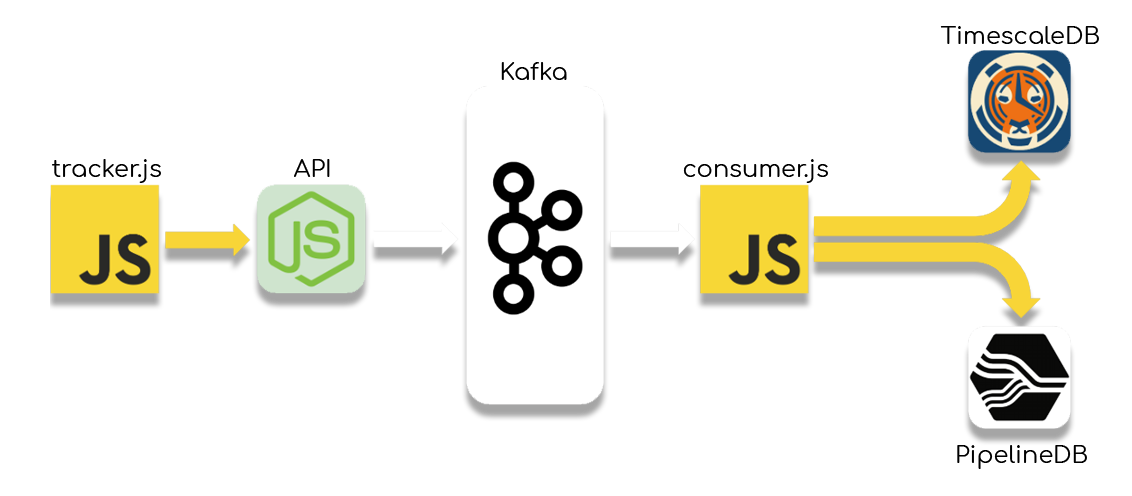
The system architecture of Chronos. Events are captured in a tracker and are sent to a NodeJS API server. From there they go through an Apache Kafka cluster, and a consumer writes them simultaneously to PipelineDB and TimescaleDB.
Chronos: Capturing Events
Chronos captures events on the client side by using a tracker.js file. The tracker itself is compiled from multiple files by using Browserify and automates the capturing of the following events:
- pageviews
- mouse movements
- mouse clicks
- link clicks
- key presses
- form submissions
In addition to this, the tracker captures metadata about the page in which the events occur, such as:
- the url of the page
- the title of the page
- the user agent
- the language of the browser
- whether cookies are allowed
- a uuid
The tracker first checks to see if a uuid exists within the window.sessionStorage object. If not, it creates one and stores it there.
While capturing most of these events did not prove difficult, we did encounter difficulties when capturing mouse movements. Our first attempt was to add an event listener to the mousemove event which would store the x and y coordinates of the mouse in an object. We then had a setInterval() call that checked every 10ms whether the mouse had moved from its previous position, and to both record it if it did and reset the current position to this new location
let mousePos;
let prevMousePos;

document.addEventListener('mousemove', (event) => {
  mousePos = {
    x: event.clientX,
    y: event.clientY,
  }
});

setInterval(() => {
  const pos = mousePos;

  if (pos) {
    if (!prevMousePos || prevMousePos && pos !== prevMousePos) {

      prevMousePos = pos;
    }
  }
}, 100);
By using setInterval() we were able to standardize the amount of data we were capturing in the mousemovement event across browsers since each has their own implementation of the rate of capture.
However, when we began to try and send the events directly to the API, the system began raising net::ERR_INSUFFICIENT_RESOURCES exceptions in certain browsers. We first attempted to reduce the granularity of the event to 20ms and then to 1000ms but kept running into the same error. Furthermore, on browsers that did not have this problem, the API began to choke on the sheer number of requests very quickly.

A solution to this is to send the events in batch by storing them in a buffer and then sending the buffer when either a) it is full, or b) when the user begins to leave the page. Once we did this both the browser and the API stopped experiencing issues.

Payload Size
In our the first design of our buffer, we sent each event over to the server as a JSON object. We tested the size of the events by sending a buffer with only link click events with the same values along with a consistent write key and metadata object to a Ubuntu server that had 4GB of RAM and 80GB of space. In this scenario, each event was roughly 92 bytes in size, and so a buffer containing 1,150 events would return a 413 error from the server.
[
  {
    "ACCESS_KEY": ...,
    "data": [
      {
        "eType": "link_clicks",
        "link_text": "Come check out our gallery of photos!",
        "target_url": "foo.com/images",
        "client_time": "2018-12-15 00:34:03.8+00"
      },
      // Many more events...
    ],
    "metadata": {
      { ... }
  }
]
While a max buffer size of 1,150 events seems reasonable, we wanted to make sure to get as large of a payload as possible in order to ping the API less often. 1,150 events isn't as many as it may first seem when you remember that Chronos captures certain events such as key presses and mouse movements at a very small granularity. This problem will only increase in future iterations as Chronos captures even more events.
We were able to optimize the buffer by removing the keys of the JSON object and instead sending all of the values in a nested array. Since the value at index 0 is the name of the event, we could use that information on the server side to write the data to the appropriate table in the databases. By doing this, we reduced the size of each of the events to roughly 42 bytes, allowing us to increase the maximum buffer size to over 2,500 events (a 100%+ increase in payload).
[
  {
    "ACCESS_KEY": ...,
    "data": [
      [
        "link_clicks",
        "Come check out our gallery of photos!",
        "foo.com/images",
        "2018-12-15 00:34:03.8+00"
      ],
      // Many more events...
    ],
    "metadata": {
      { ... }
  }
]
While our next thought was to serialize the data into binary, a key problem is that we could never guarantee the size of our buffer, nor the values of the metadata object, nor the write key. Therefore, we could not take advantage of any optimized binary serialization techniques. We could instead just serialize the entire UTF-16 string into binary, but the minimum byte size for each character would be 8 bits which ended up being no more effective than just sending the string as is.
Beacon API and Error Handling
By default, the tracker sends the data to the API server by using the Beacon API, which is a standard way for browsers to schedule periodic requests to a server. This API was designed with analytics and diagnostics in mind as it allows for data to be sent in an asynchronous POST request that is non-blocking and thus doesn't interfere with the user's experience of the application. However, the Beacon API doesn't support error handling since it doesn't usually require to receive a response back from the server. To handle errors, Chronos also allows for the Fetch API to be used.
Security Concerns
Since the tracker file lives on the client side, it presents inherent difficulties with security since the code can always be examined. As such, a malicious user can exploit the tracker to send corrupt data. However, client side security is an inherently difficult concept given the nature of how browsers work:
There’s no way to both allow clients to send data to Keen and prevent a malicious user of a client from sending bad data. This is an unfortunate reality. Google Analytics, Flurry, KissMetrics, etc., all have this problem. Keen IO
As such, we provided two layers of security. The first is that we provide a write key which exists both on the server side and is imbedded withint the tracker when it is compiled. When data is sent to the server we use middleware to check if the write key in the client matches that of the server. If it doesn't, the request is rejected. This way, if a developer notices that bad data is coming through to the server, the api key can be re-generated and thus prevent the malicious writes from coming through.
The second layer of security is that another piece of middleware contains a listing of permitted host addresses that can write data to the server. If the incoming request comes from a host that isn't white listed, the server rejects the request.
Server Infrastructure
Once the data reaches the server, our first design was to iterate over the buffer of events and append the metadata object to each of them and then to write them directly to the database. However, for the reasons detailed above, we decided to utilize a messaging queue in order to modularize our system. By doing this, we were able to simplify our API code so that all received data was send to a topic to be consumed later on.
try {
  const json = JSON.stringify(req.body['data']);

  producer.send(topic, { json });
  res.send(JSON.stringify({"success": true}));
} catch (e) {
  res.send(JSON.stringify({
    "success": false,
    "error": String(e)
  }));
}
Which Queue to Choose
The two choices for a messaging queue that were immediately apparent to us were RabbitMQ and Apache Kafka. While Apache Kafka had an uncontested higher throughput (20,000mps vs 100,000mps), RabbitMQ is generally regarded as having an easier learning curve than Kafka, and since we were dealing with greenfield applications we may be okay with the smaller throughput.
However, there were two drawbacks with using RabbitMQ. First, the AMQP protocol that RabbitMQ is built upon cannot guarantee the ordering of messages received by a consumer. This is because if a consumer goes down while the queue is trying to send it a message, it will try the message again later on, but other messages in the queue may be sent before retrying the failed message.
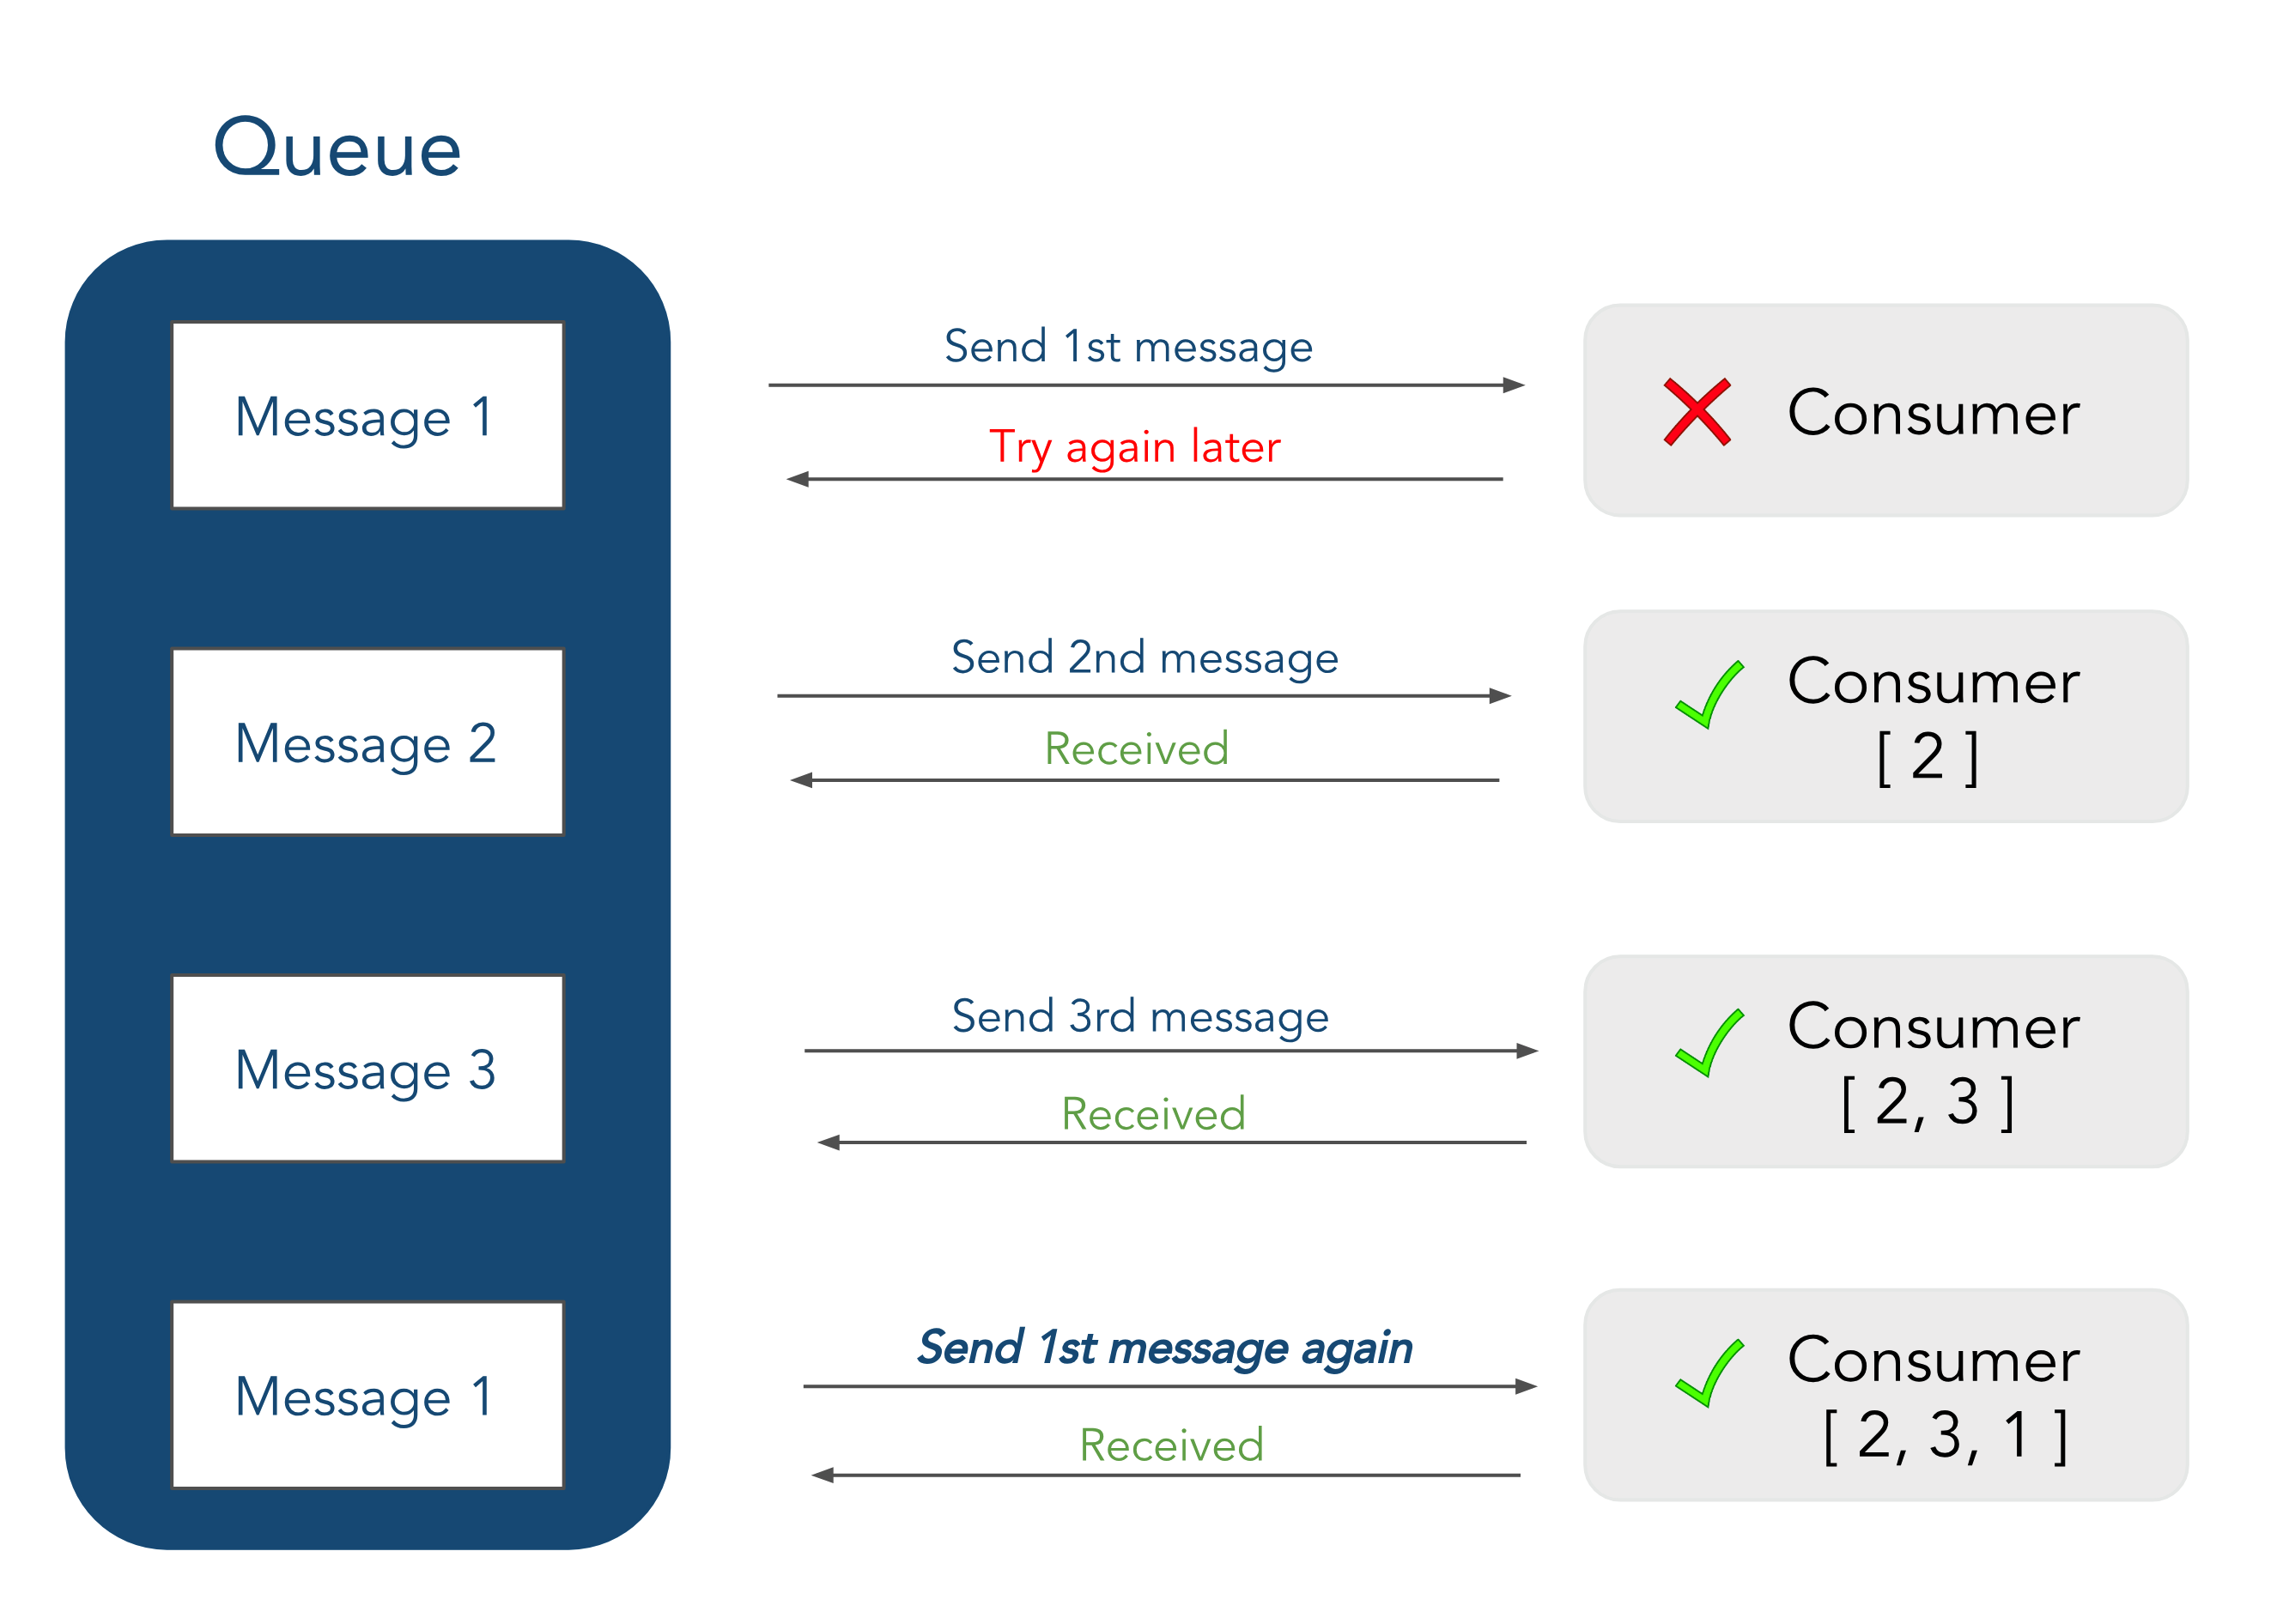
This wasn't an immediate concern for us since in our infrastructure the order of events isn't of paramount concern.
That said, what was a major concern for us was the fact that RabbitMQ doesn't support data retention: once a message has been read by the consumer and an acknowledgement has been received, it is removed from the queue. This means if we ever wanted to add a new consumer to read data from our topic we would have to create some kind of worker to move data from that topic that now resides elsewhere to the new piece of architecture.
Since Chronos is a framework, we wanted it to be relatively easy for a developer to add a new data sink to send data to. By using Kafka, all the developer would have to do is set up a new consumer and then subscribe to the topic. Though it would be harder for us to implement, by choosing Kafka we could guarantee this ease of flexibility since Kafka holds on to any data sent to it (albeit for a specified limited time) and allows for it to be replayed.
Apache Kafka
Though we described Kafka as a messaging queue earlier, it could more aptly be described as an append-only log where messages written to a topic are append to those before it and retained for a set period of time. It's this data retention that allows for messages to be replayed by consumers that allows for Kafka to have exactly-once message guarantees. This means that data sent to Kafka is treated as immutable.
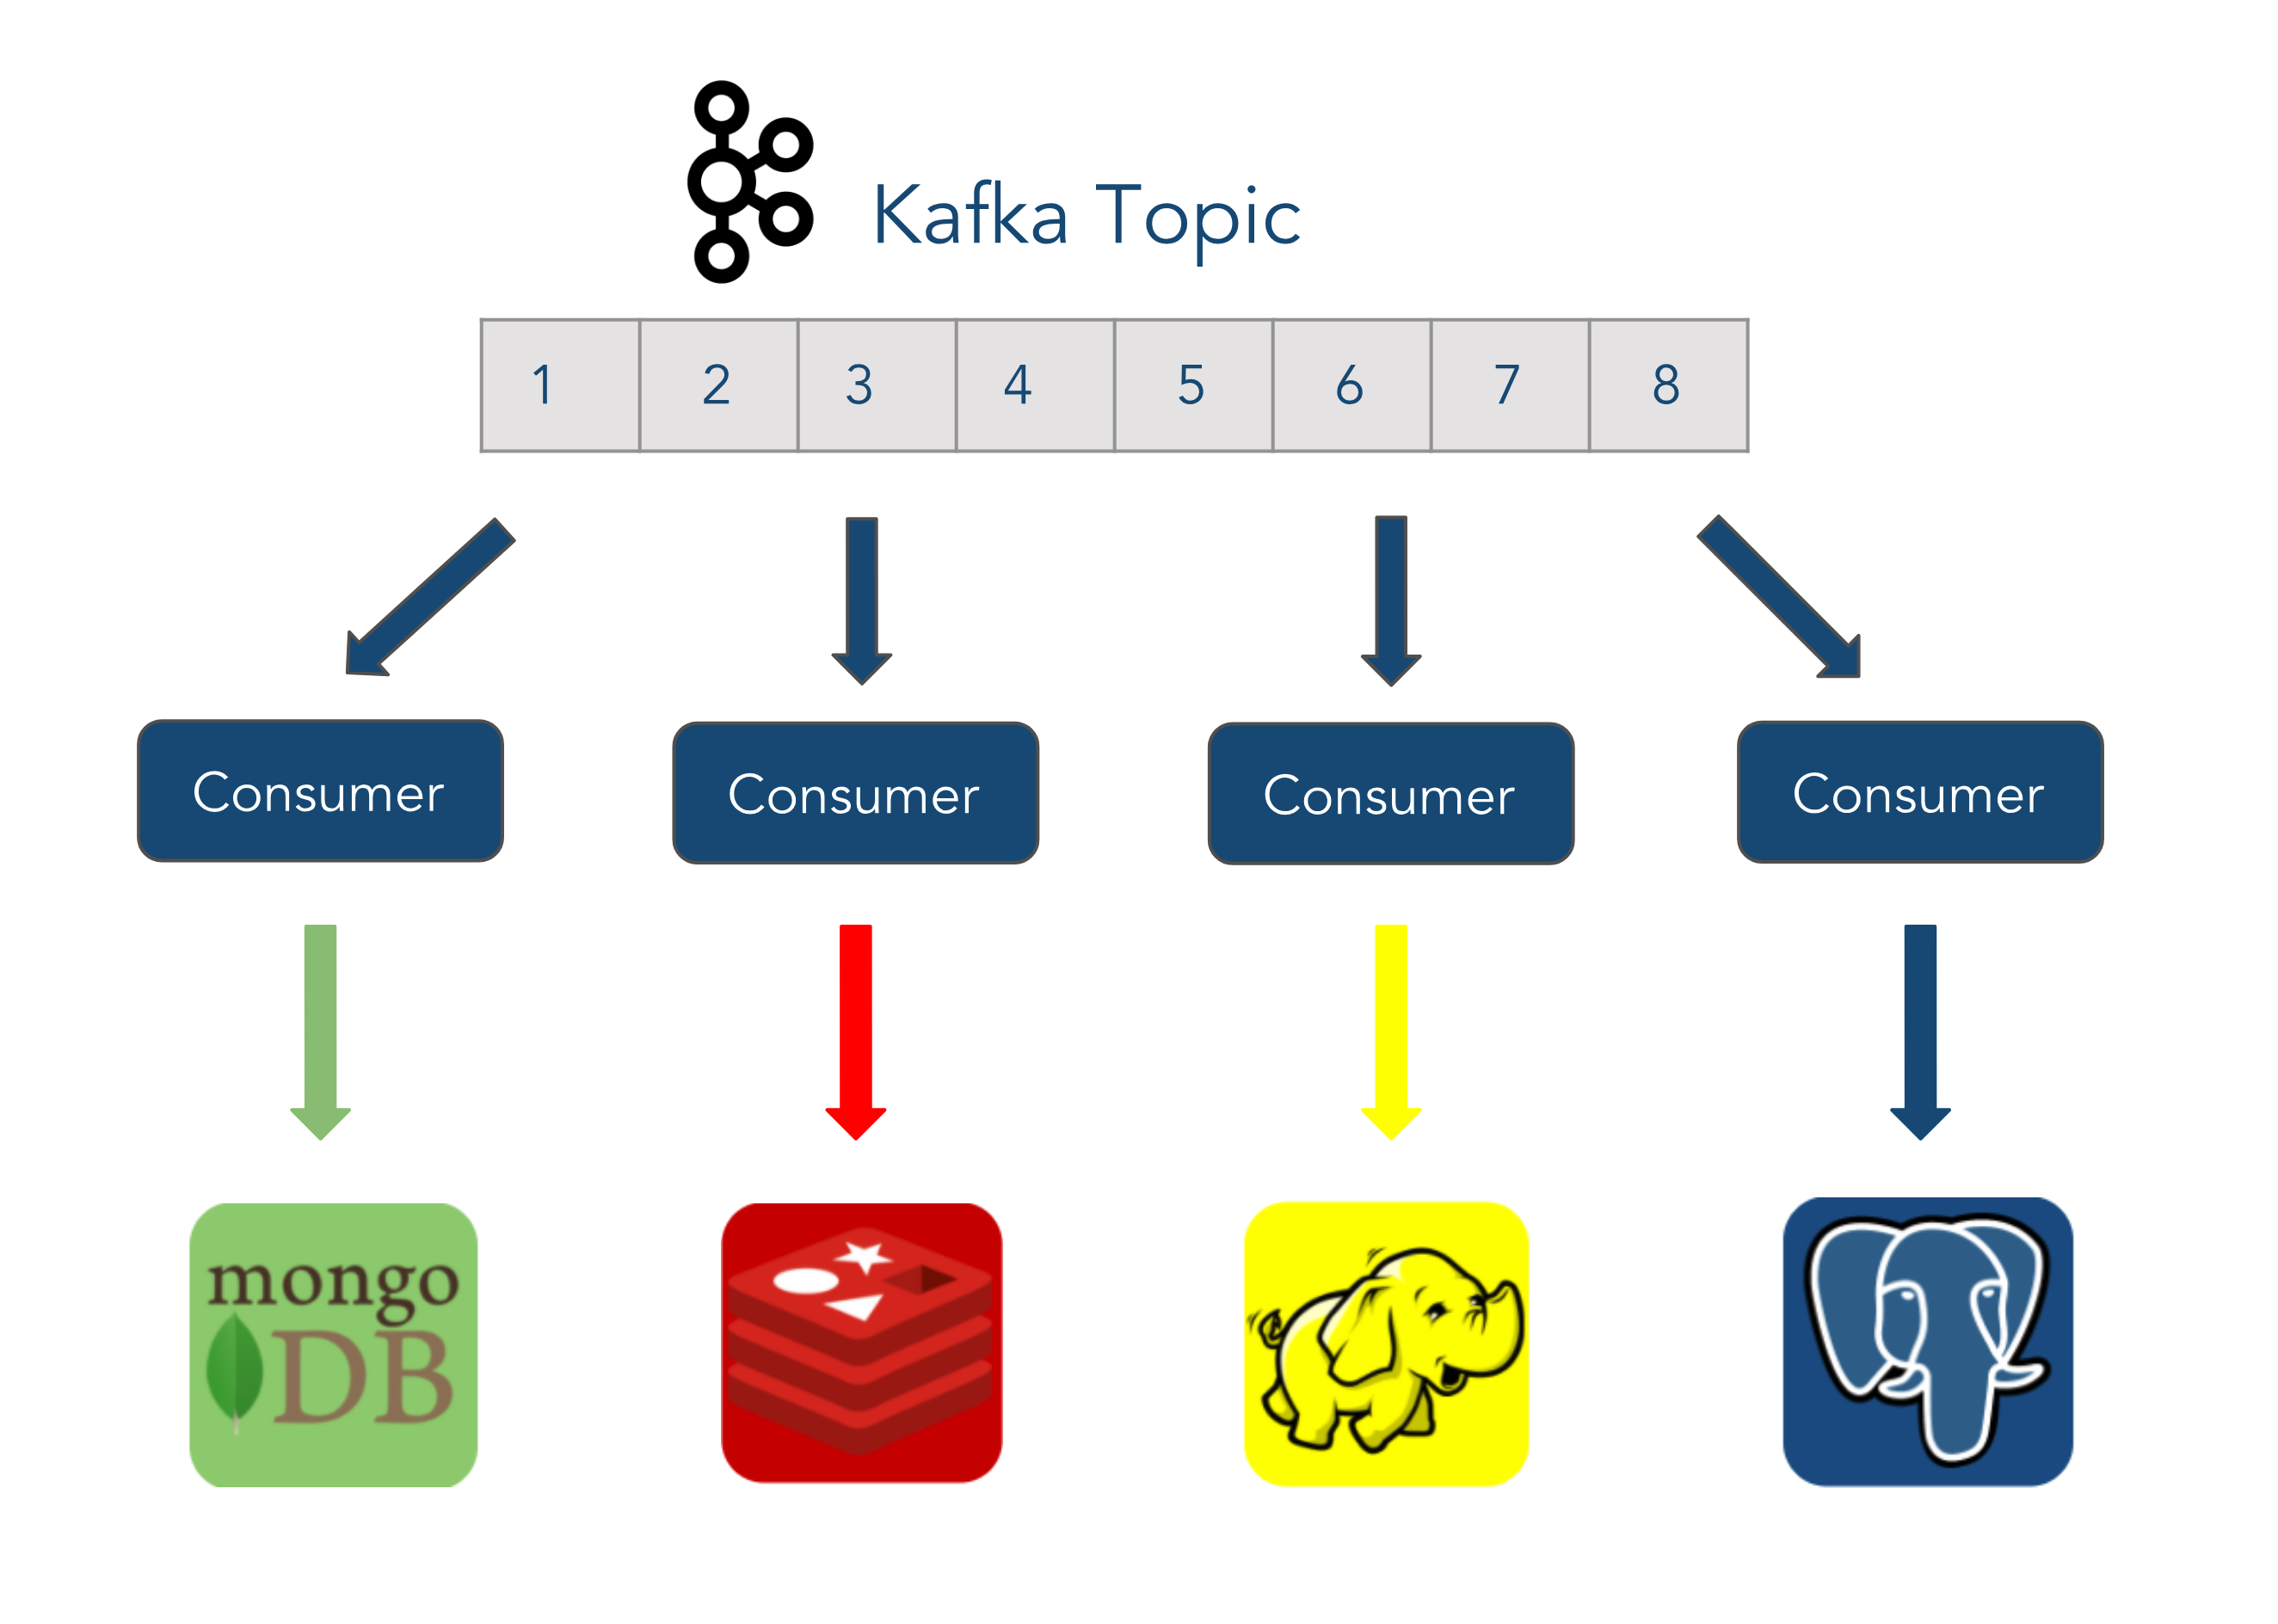
As mentioned above, Kafka uses a Pub/Sub architecture where producers write data to topics and consumers read data from them. Topics themselves are split into one or more partitions that can be split across a number of Kafka Brokers (server). Message ordering is only guaranteed within a partition, and not across, so if messaging order is paramount all data must pass through a single partition.
Partitions themselves contain offsets which mark the various messages within the partition. Consumers read from the partition based upon an offset and can read starting from different offsets. While multiple partitions belong to a topic, there is no inherent correlation between the offsets of various partitions and what message data they contain.
Partitions themselves (and not topics) live on Kafka Brokers, each of which have their own id. Multiple brokers that communicate with each other are referred to as a "cluster," and the partitions themselves are assigned automatically to the brokers. The brokers are able to communicate with one another via Apache Zookeeper (which also manages the brokers in a cluster in general).
As stated previously, producers write data to a topic. By default, they will write the data in a round-robin fashion to the partitions, but you may also specify a key which will be hashed in order to determine which partition to write to. Likewise, consumers read data from a particular topic, more specifically in order starting from an offset within a partition. Consumers automatically "know" which broker to read the data from and will commit their offsets after reading data, which allows a consumer that goes down to pick back up where it left off once it recovers. Both producers and consumers automatically recover and adapt to brokers going up and down, which increases the availability of the overall system.
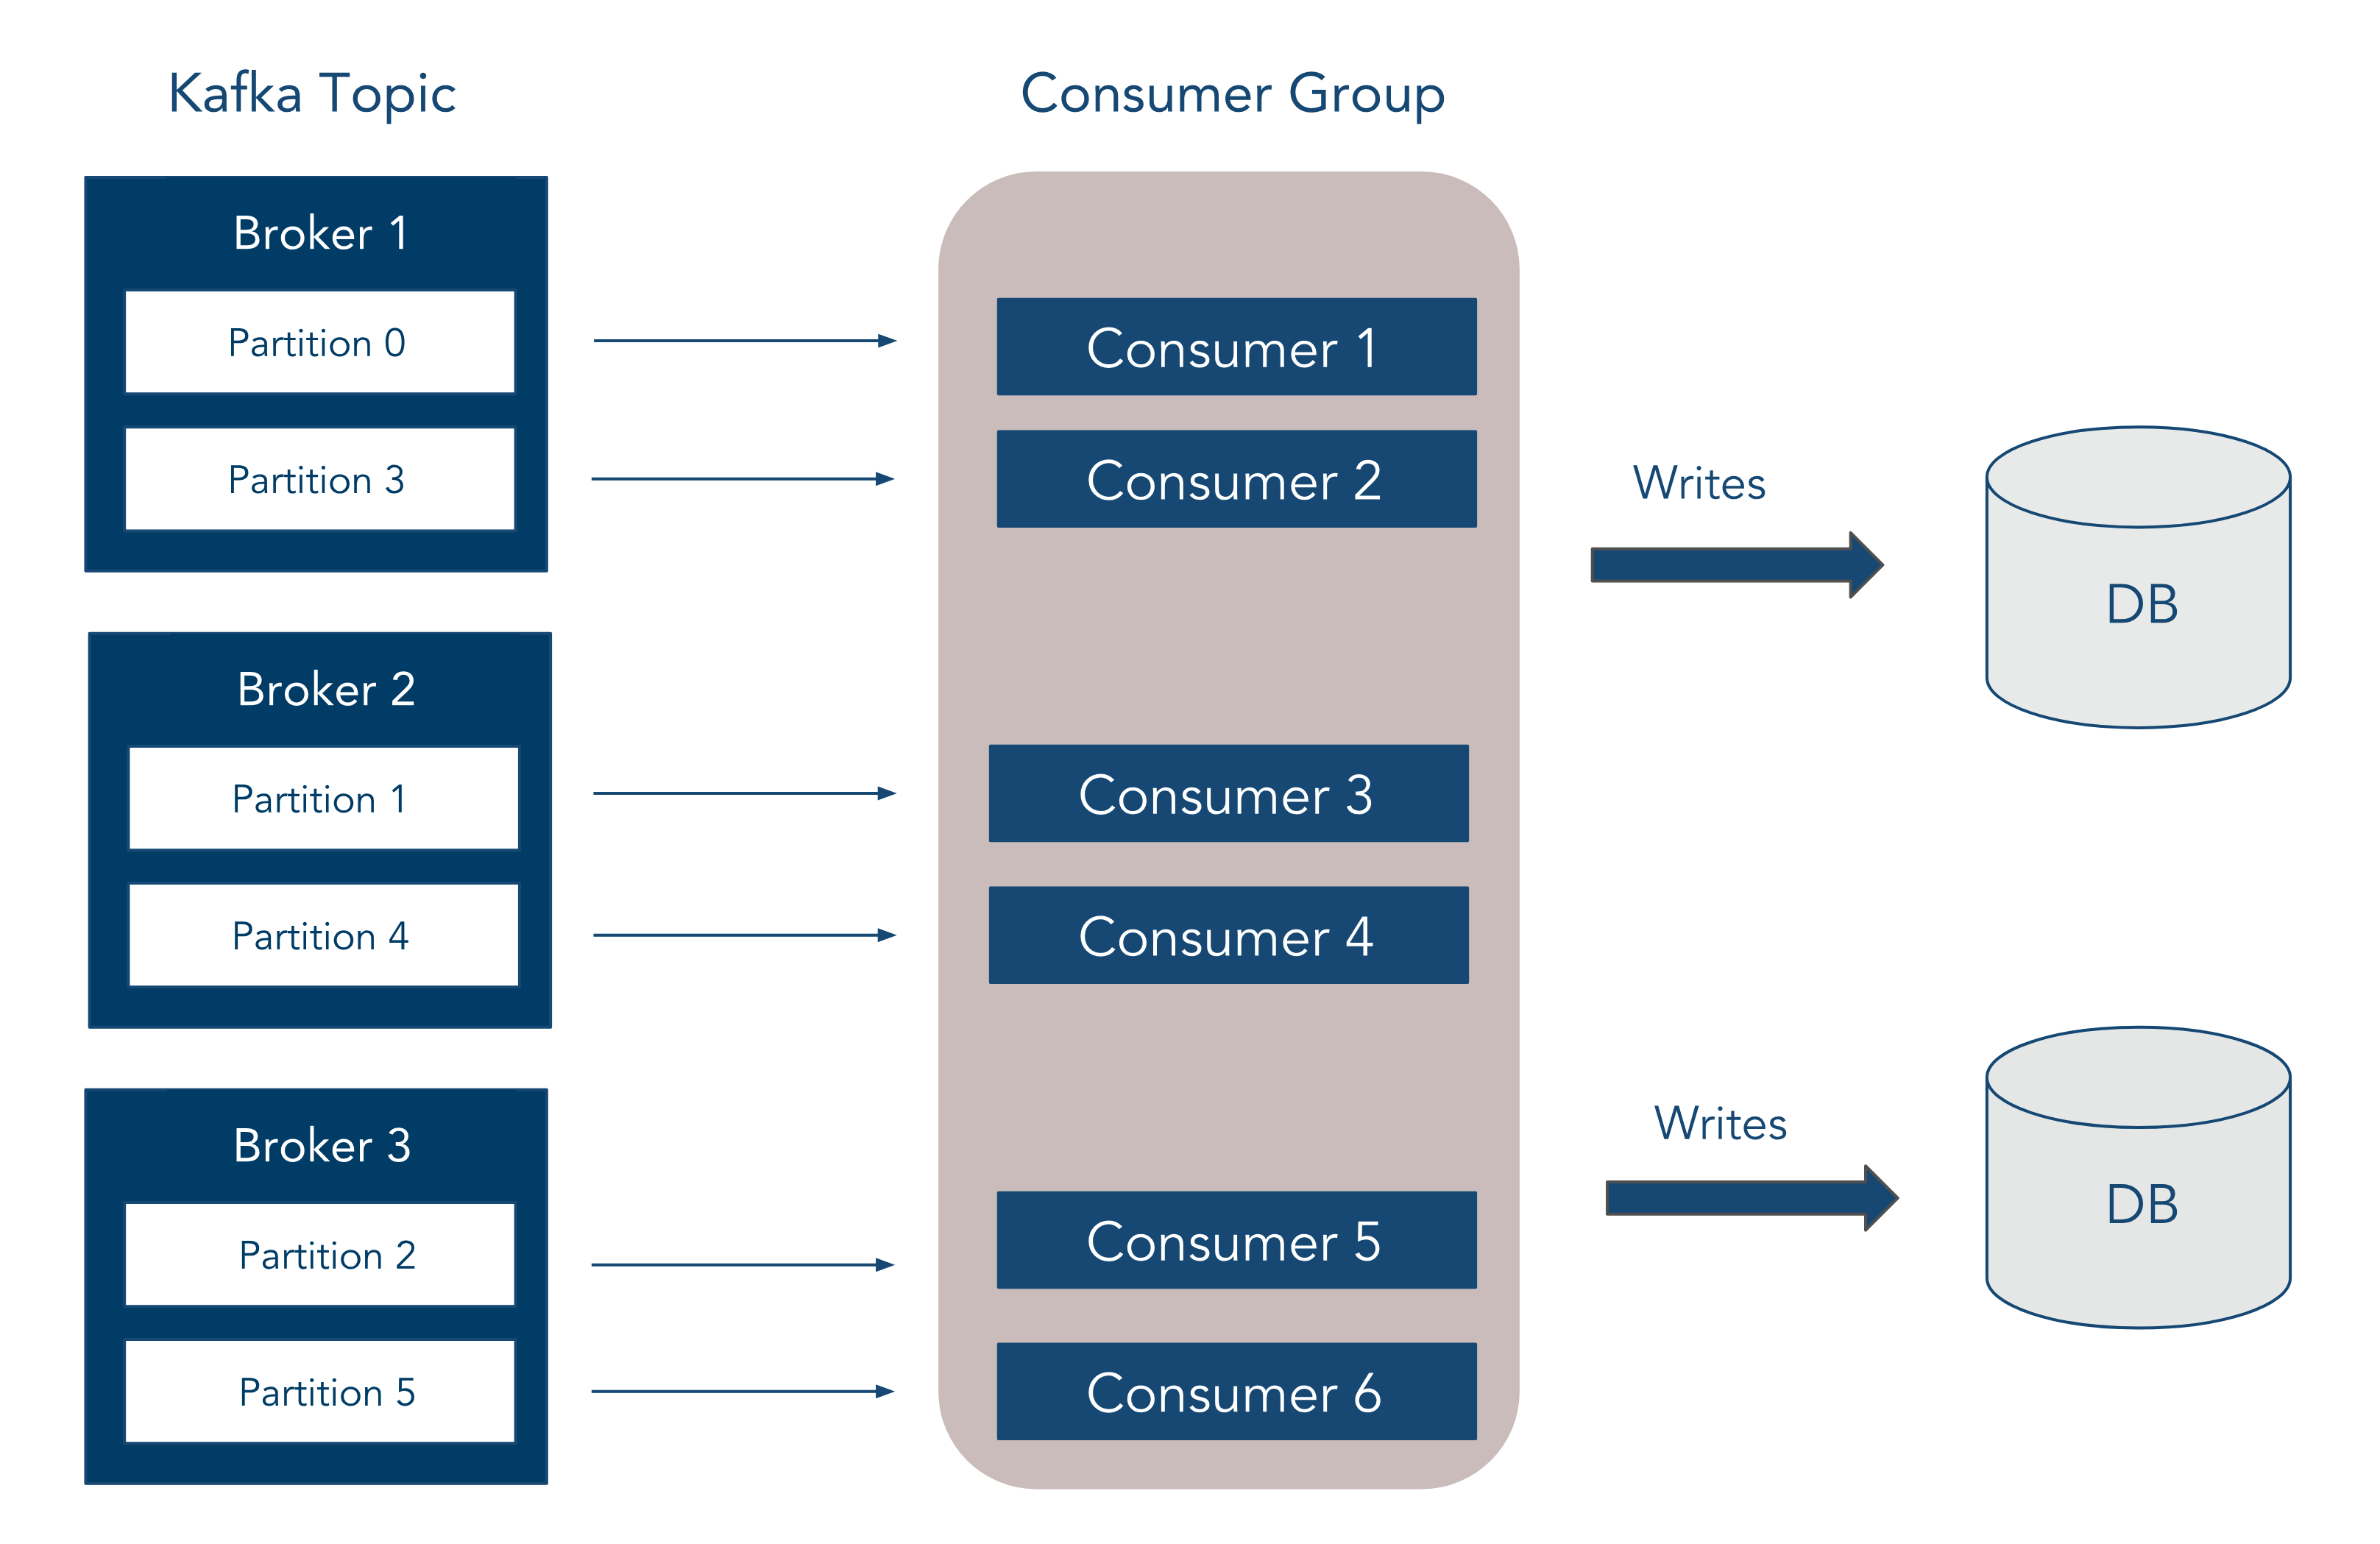
In the case of Chronos, we have a single events topic which is across 3 brokers. We chose 3 brokers to increase availability since we can support up to N - 1 brokers going down. This way, if one broker is taken offline for any kind of management, and another one unexpectedly crashes, we still have one broker remaining to push the data to. Since message ordering wasn't a concern, we split the topic into 6 partitions (2 per broker) in order to increase parallelism and thus throughput. There is a chronos consumer group that contains 6 consumers, one for each partition, that reads the data and then writes it to the databases.
While Kafka helped to decouple our system and make it a streaming system at its core, it did introduce some new problems. Firstly, Kafka can be difficult to set up and configure, and we wanted to abstract and standardize that process away from the developer so that the host OS for deployment wasn't a concern. Secondly, Kafka does require monitoring and management, and we didn't want the developer to be bogged down managing Kafka as opposed to working on the core of the application at hand.
Docker
We use Docker in order to configure and standardize our Kafka setup so as to make deployment as painless as possible for the developer. By utilizing the isolating capabilities of containers, we can deploy our Zookeeper and Kafka Cluster setup on various environments and so not limit the developer to whatever OS we built Chronos in.
We use Confluent's Kafka images because a) the Confluent team keeps their images up to date since they are the creators of Kafka, and b) they provide robust documentation and tutorials for using Kafka in Docker. We orchestrate the setup of our containers by using Docker Compose and linking our 3 brokers to our Zookeeper container. We use volumes to persist both the Zookeeper logs as well as the data for Zookeeper and all 3 brokers:
version: '3'
services:
  zookeeper:
    image: confluentinc/cp-zookeeper:latest
    environment:
      ZOOKEEPER_CLIENT_PORT: 2181
      ZOOKEEPER_TICK_TIME: 2000
    volumes:
      - zk-data:/var/lib/zookeeper/data
      - zk-txn-logs:/var/lib/zookeeper/log

  kafka-1:
    image: confluentinc/cp-kafka:latest
    depends_on:
      - zookeeper
    environment:
      KAFKA_BROKER_ID: 1
      KAFKA_ZOOKEEPER_CONNECT: zookeeper:2181
      KAFKA_ADVERTISED_LISTENERS: PLAINTEXT://kafka-1:29092
      KAFKA_LISTENER_SECURITY_PROTOCOL_MAP: PLAINTEXT:PLAINTEXT
      KAFKA_INTER_BROKER_LISTENER_NAME: PLAINTEXT
      KAFKA_OFFSETS_TOPIC_REPLICATION_FACTOR: 1
    volumes:
      - kafka1-data:/var/lib/kafka/data

  kafka-2:
    image: confluentinc/cp-kafka:latest
    depends_on:
      - zookeeper
    environment:
      KAFKA_BROKER_ID: 2
      KAFKA_ZOOKEEPER_CONNECT: zookeeper:2181
      KAFKA_ADVERTISED_LISTENERS: PLAINTEXT://kafka-2:29092
      KAFKA_LISTENER_SECURITY_PROTOCOL_MAP: PLAINTEXT:PLAINTEXT
      KAFKA_INTER_BROKER_LISTENER_NAME: PLAINTEXT
      KAFKA_OFFSETS_TOPIC_REPLICATION_FACTOR: 1
    volumes:
      - kafka2-data:/var/lib/kafka/data

  kafka-3:
    image: confluentinc/cp-kafka:latest
    depends_on:
      - zookeeper
    environment:
      KAFKA_BROKER_ID: 3
      KAFKA_ZOOKEEPER_CONNECT: zookeeper:2181
      KAFKA_ADVERTISED_LISTENERS: PLAINTEXT://kafka-3:29092
      KAFKA_LISTENER_SECURITY_PROTOCOL_MAP: PLAINTEXT:PLAINTEXT
      KAFKA_INTER_BROKER_LISTENER_NAME: PLAINTEXT
      KAFKA_OFFSETS_TOPIC_REPLICATION_FACTOR: 1
    volumes:
      - kafka3-data:/var/lib/kafka/data
Snippet from our docker-compose.yml file.
Chronos CLI
While using Docker solved how we can deploy our cluster in various environments, it did introduce some new concerns. The first was one of run-time conditions: we cannot always guarantee the order in which our serivces boot up using Docker Compose, and this can lead to errors when the brokers attempt to connect to Zookeeper if Zookeeper isn't up and running first.
A quick solution to this is to run the Zookeeper container in detached mode for 5-10 seconds before running the rest of the system:
docker-compose up -d zookeeper
// 5-10 seconds later
docker-compose up
While this works, it's an inelegant solution and would require at least some knowledge of how Docker works.
Second, there were still some installation issues even after switching over to Docker. As for our Kafka Cluster, we still need to create the events topic that the data will be written to before running the whole system. This requires booting up the entire cluster and then knowing the Kafka CLI command for creating the topic:
docker-compose up -d zookeeper
docker-compose up -d kafka-1
docker-compose up -d kafka-2
docker-compose up -d kafka-3
docker exec -it chronos-pipeleine_kafka-1_1 kafka-topics \
--zookeeper zookeeper:2181 --create --topic events \
--partitions 6 --replication-factor 3 --if-not-exists
docker-compose stop
In order to abstract these details away from the user, we created a CLI which wraps around the various docker and docker-compose commands and automatically deals with the race conditions. Thus, starting the system is done by running chronos start, and the elaborate Kafka installation above is now done by running chronos install-kafka. In total, the CLI supports the following commands:
| Command | Description |
|---|---|
start [service] |
Starts either Chronos or a specified service |
stop [service] |
Stops either Chronos or a specified service |
log (service) |
Prints the logs of a service to the terminal |
status |
Prints the status of the services to the terminal |
install-kafka |
Installs the events topic used by the Kafka brokers |
install-pipeline |
Sets up the chronos_pl database used by PipelineDB |
help |
Displays a manual page with a description of the various commands and the arguments they take |
Storing Event Data
Once the data goes through Kafka to the consumer, the consumer then writes the data to our database layer. Given the previous discussion between various data stores, we were originally set on using NoSQL due to SQL's difficulties in storing event data. However, we were really reluctant to give up SQL as our data exploration language. In addition to this, SQL is still more well known by a variety of developers as opposed to the various querying languages found in NoSQL databases.[5] These benefits are right in line with our use case since we wanted to store our data for data exploration, and we want to appeal to as wide a developer audience as we can. As such, instead of settling on a NoSQL database we instead used two SQL databases that were designed for capturing event data, more specifically TimescaleDB and PipelineDB.
TimescaleDB
TimescaleDB is a PostgresSQL extension that works out-of-the-box with the plugins and features developed by the Postgres community over the years. Timescale realized that when working with time-series data, “if the data [was] sorted by time, we would always be writing towards the ‘end’ of our dataset.”[4] Thus we could keep the “actual working set of database pages rather small” and stash them in memory, and cache data for queries for recent intervals.
To overcome the problems above in using a SQL database for time-series data, Timescale used a chunking strategy where it splits data into distinct tables via two dimensions: a time interval and a primary key. These individual chunks are then stored in separate tables which greatly reduces the size of indexes as they are only built across the smaller chunks rather than a single giant table. This also means that properly sized chunks along with their B-trees can be stored entirely in memory which avoids the “swap-to-disk problem, while maintaining support for multiple indexes.”[4] Once the chunks are partitioned by time, they can then be partitioned again by a primary key which leads to even smaller chunks that share a “time interval but are disjoint in terms of their primary key-space,” which is better for parallelization.
In Chronos we use TimescaleDB to store all of our raw event data for data exploration purposes. By doing this we allow developers to use the power of SQL for data exploration without having to sacrifice the performance degradation one typically sees with SQL databases when dealing with event data. However, there are two current problems Chronos faces when using TimescaleDB:
- TimescaleDB as of this writing has no horizontal scaling capabilities (i.e. sharding), which limits it to a single node. This isn't as immediate of a concern for Chronos since the system is built for greenfield applications where scaling isn't as immediate a concern. However, Timescale plan to finish implementing sharding in 2019, so this will no longer be a problem
- TimescaleDB maxes out on its performance capabilities between 50-100TB of data. Any more will lead to degradation. Since Chronos can collect a large amount of data relatively quickly, especially if a greenfield application begins to rise in popularity, this is a concern. In future iterations, Chronos plans to implement a cold storage system that will move data from TimescaleDB that is older than a month old (see "Future Plans" below)
Each event type is stored in its own table where the various attributes of the event are stored in their own column. Initially we were undecided as to whether we should store the metadata in its own table, or store it as a JSON object into a JSONB column. Since storage efficiency is a concern for Chronos, we decided to see how the size would look if the metadata was stored in its own table as well as in a column. We set up tables to store link clicks in both fashions, as well as a metadata table.
link_clicks table (with metadata column):
| Column Name | Values |
|---|---|
| id | SERIAL NOT NULL |
| link_text | TEXT |
| target_url | TEXT NOT NULL |
| time | TIMESTAMP NOT NULL DEFAULT NOW() |
| metadata | JSONB NOT NULL |
| local_time | TIMESTAMP NOT NULL |
link_clicks table (no metadata column):
| Column Name | Values |
|---|---|
| id | SERIAL NOT NULL |
| link_text | TEXT |
| target_url | TEXT NOT NULL |
| time | TIMESTAMP NOT NULL DEFAULT NOW() |
| local_time | TIMESTAMP NOT NULL |
metadata table:
| Column Name | Values |
|---|---|
| id | SERIAL NOT NULL |
| event_id | INTEGER NOT NULL() |
| url | TEXT NOT NULL |
| user_agent | TEXT NOT NULL |
| page_title | TEXT NOT NULL |
| cookie_allowed | TEXT NOT NULL |
| language | TEXT NOT NULL |
| event_type | EVENT* NOT NULL |
| time | TIMESTAMPZ NOT NULL |
*EVENT is a TYPE that contains a list of all event types
We then inserted 50 rows of data in each table and used TimescaleDB’s hypertable_relation_size() function on each of them. What we found was that each table’s bite size (excluding indexes and TOAST) was 49,152 bytes. This means by storing the JSON in a metadata column, we effectively halve the storage space. While this does make querying the metadata slightly harder, we felt this was a good tradeoff given the storage benefits.
By using TimescaleDB, Chronos now provides an easy way for developers to explore their data to find interesting trends. However, if a developer wants to see the same query at various times, the query would have to be executed manually for each window of duration. What we wanted Chronos to do was provide real-time feedback for any queries that the developer specifies so that the querying process is "automated". For this, we use our second time-series database: PipelineDB.
PipelineDB
PipelineDB is an open-source PostgreSQL extension that processes event data in real time and was designed for analytics. In the most common scenario, raw data is usually stored in databases and then aggregated over and over again when needed. Unlike entity data that is always being updated, event data is immutable and is always being appended. Therefore storing indefinite amounts of raw data can very soon pose a scaling problem. At the same time, aggregating large datasets in real-time makes read queries very inefficient.
PipelineDB doesn't store the event data. Instead it runs continuous aggreagtions over streaming event data, and only stores the summaries of those aggregations. After the raw event data is used and aggregated, it is discarded.
To better understand how PipelineDB works, we have to introduce its two fundamental abstractions: Streams and Continuous Views.
Streams in PipelineDB look like regular tables and a row in a stream looks like a table row and represents one event. But unlike regular tables, streams do not store the data. Instead, they serve as the data source to be read by Continuous Views.
When each event arrives at the stream, it is given a small bitmap that represents a list of all continuous views that need to read the event.
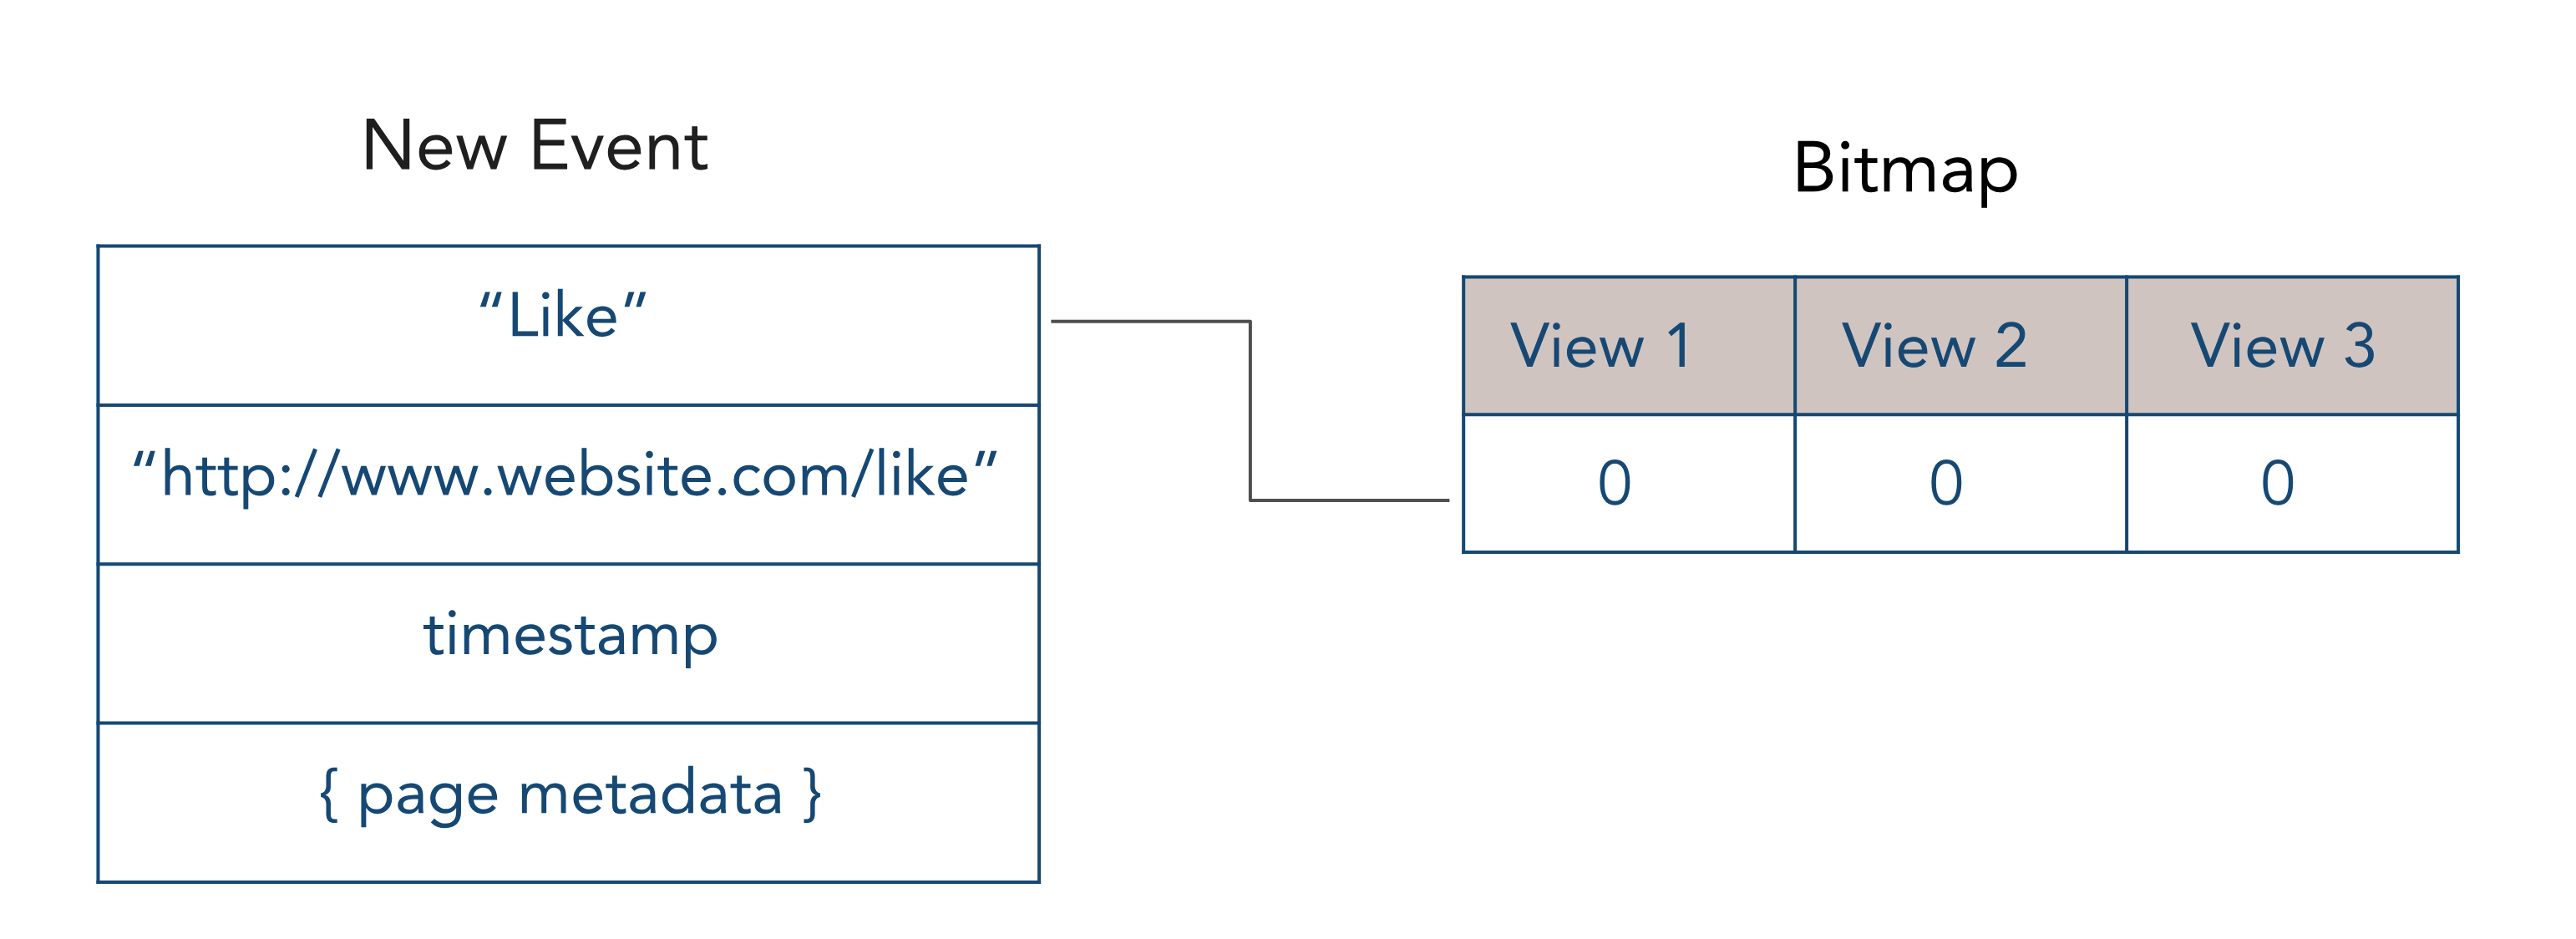
When a continuous view is done reading an event, it flips a single bit in the bitmap.
When all of the bits in the bitmap are set to 1, the event is discarded and can never be accessed again.
Once the data is consumed by the views it is discarded.
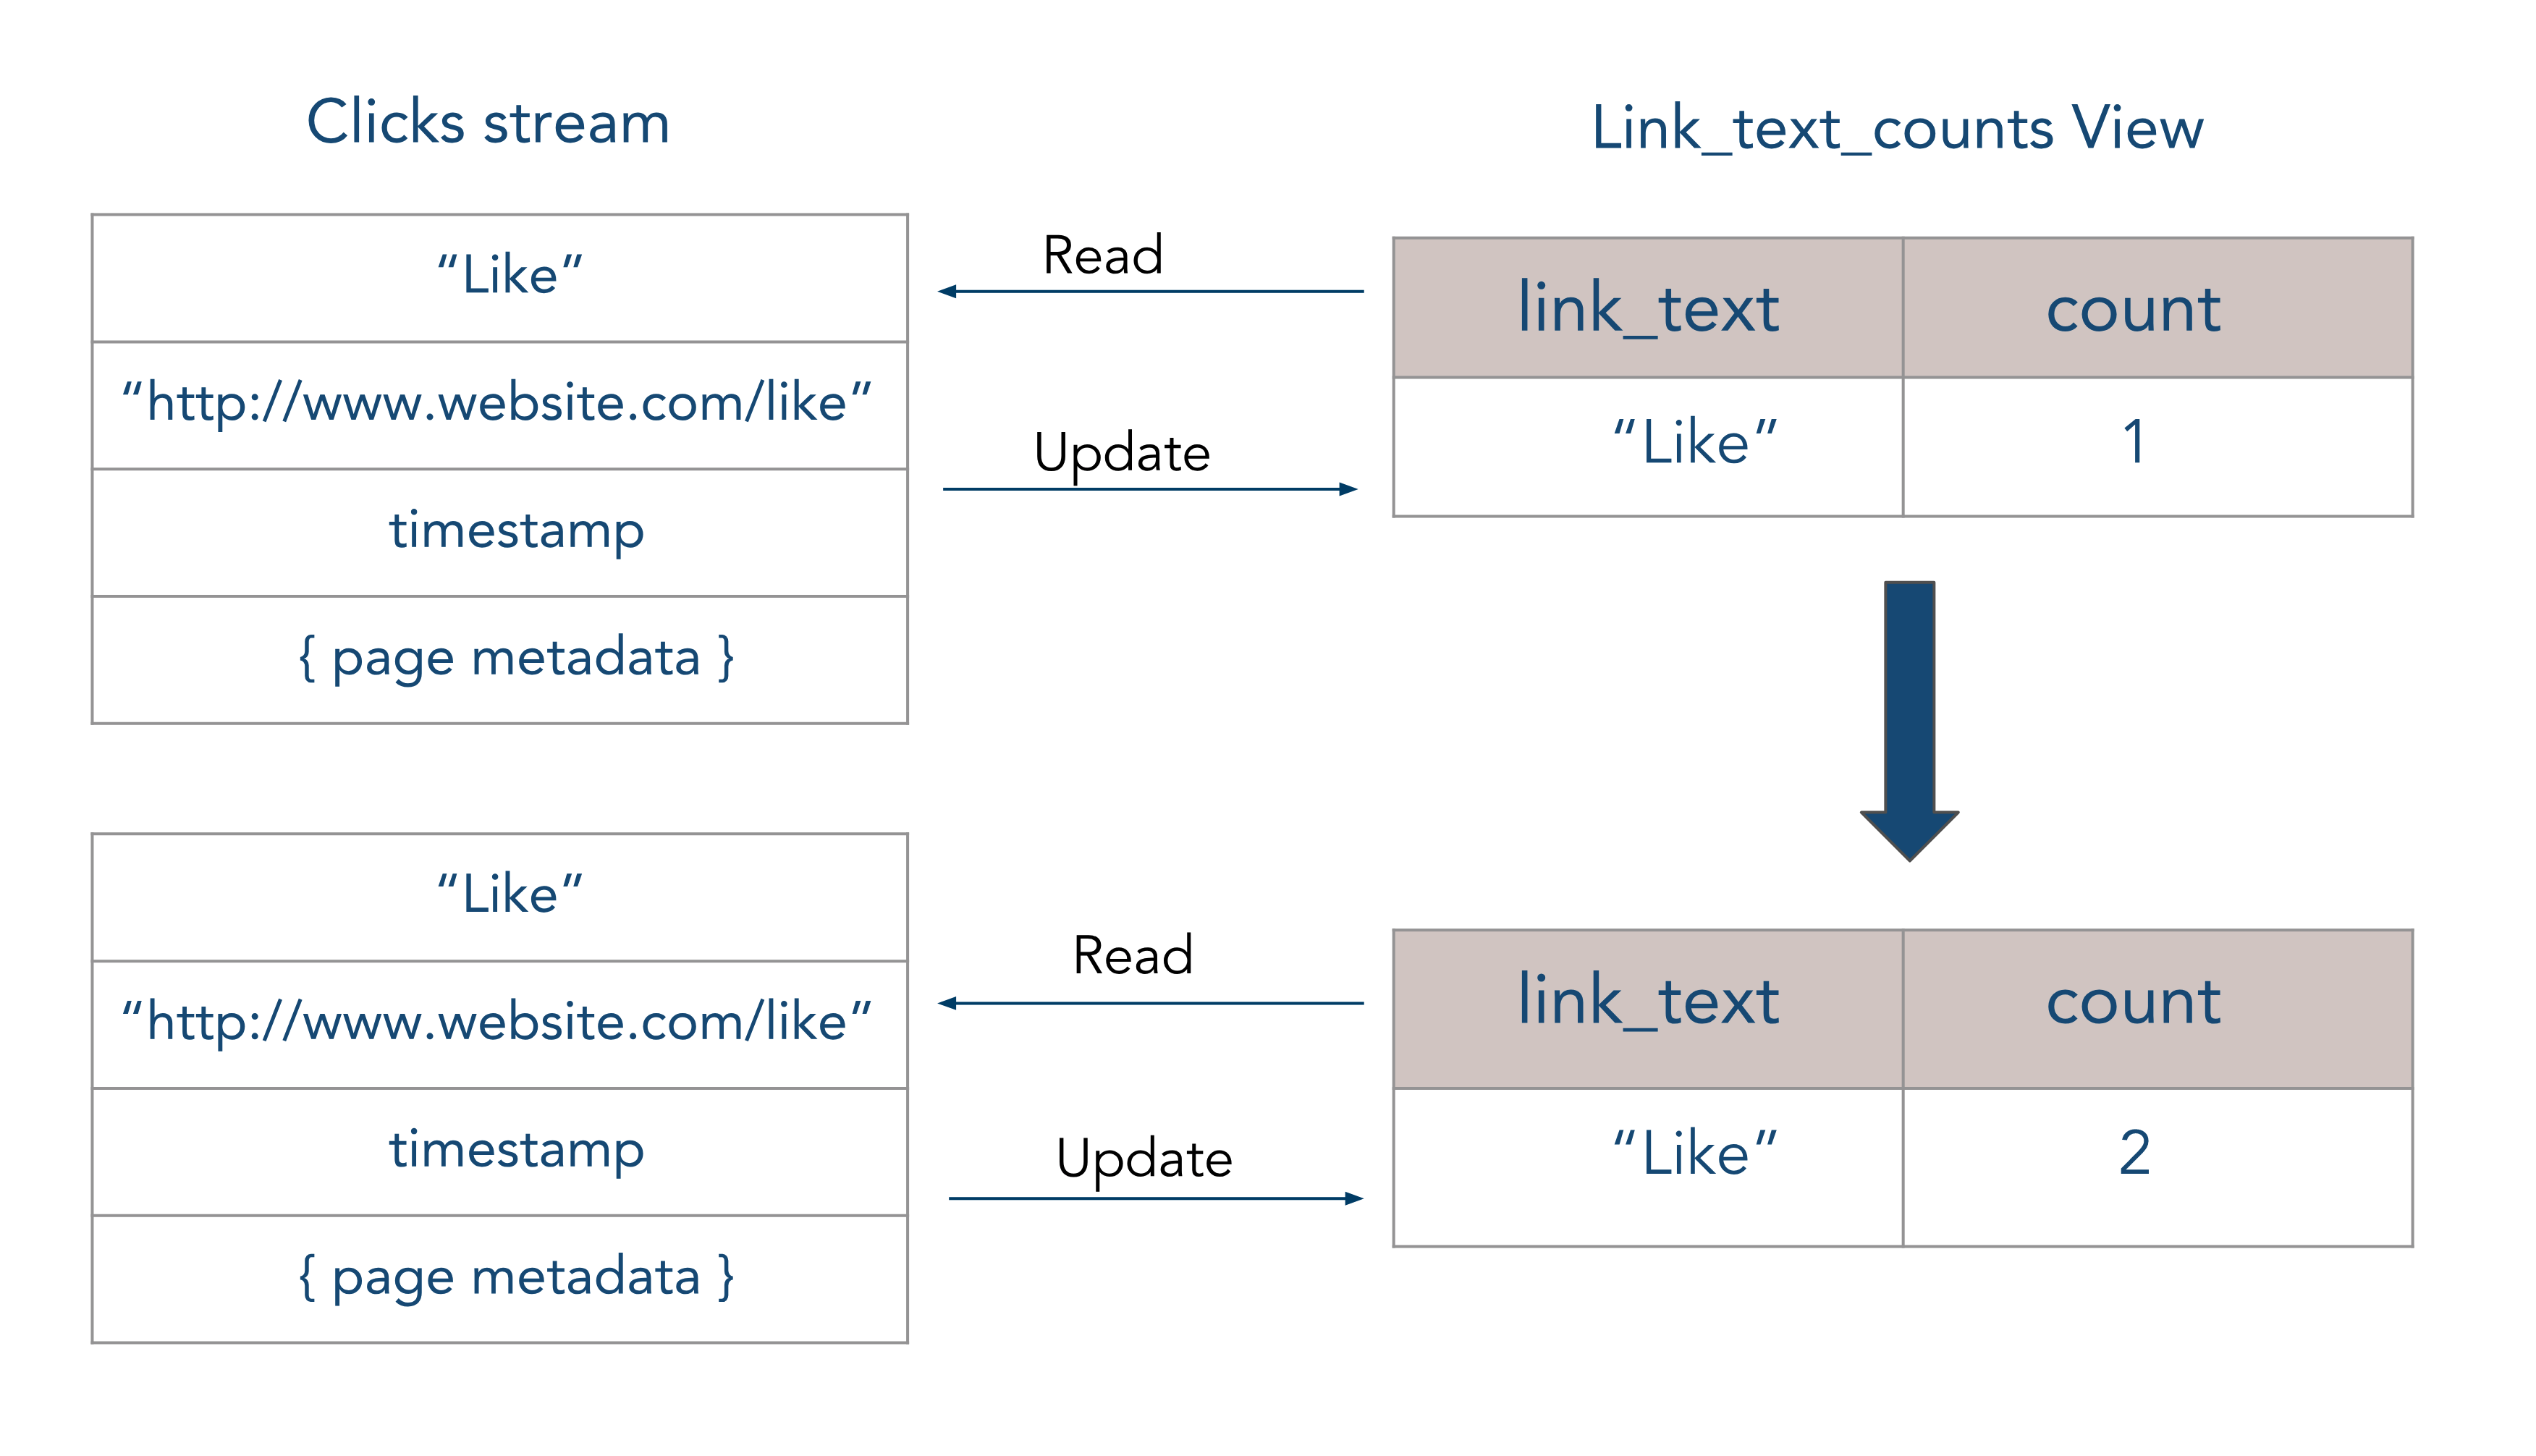
Continuous views in PipelineDB are basically PostgreSQL materialized views. A continuous view has a predefined query that is being run continuously on a stream or a combination of streams and tables. As new data arrives to the stream it's read by the views and is incrementally updated. The view only stores the updated summary.
In Chronos we used PipelineDB for use cases when there is a need for real-time summary data (unique users per page, total users submitting the form, etc) or analytics where the queries are known in advance.
Also PipelineDB, being a PostreSQL extension, allows users to use familiar SQL syntax and deal with performance issues using tried and true SQL tuning techniques.
PipelineDB Streams in Chronos
Currently, Chronos automatically creates a PipelineDB stream for each event type that it tracks.
CREATE FOREIGN TABLE link_clicks(
  link_text TEXT,
  target_url TEXT,
  client_time TIMESTAMPTZ,
  metadata JSONB
)
SERVER pipelinedb;
The data in the stream cannot be queried directly, but it is possible to look up what attributes a particular stream has. The attributes of a stream correspond to the attributes of the event type defined in the tracker (just like in our TimescaleDB tables).
By default, PipelineDB timestamps the events upon arrival and adds an additional attribute called an arrival_timestamp. However, for real-time analytics it's important to aggreagate events using the timestamp of when those events happen (i.e. event time). Using the arrival timestamp of the event might not reflect the correct state of application in the specific point in time. Even though we do include a client_time attribute which records the event time, PipelineDB's sliding windows are based upon the arrival_timestamp attribute and thus only window upon processing time.
When a user event is generated in the application, the tracker records an event type, a timestamp, state attributes describing the event, as well as any page metadata associated with it. For analytics it's very important to capture as much data characteristics as possible.
Our research showed that event metadata is not aggregated too often or not at all. But for unforseen use cases there might be a need for it in the future. So instead of defining multiple attributes in a stream for page metadata object we only defined one as a PostgreSQL JSONB type.
PipelineDB Views in Chronos
For each stream in PipelineDB, Chronos also automatically creates the views for real-time data aggregation.
CREATE VIEW link_text_counts AS
SELECT
  link_text,
  COUNT(*)
FROM link_clicks
GROUP BY link_text;
A view is described by the PostgreSQL SELECT query that specifies what type of aggregation will be performed on stream data. Every time the event arrives in a stream the query is run and the new result is stored in the view table.
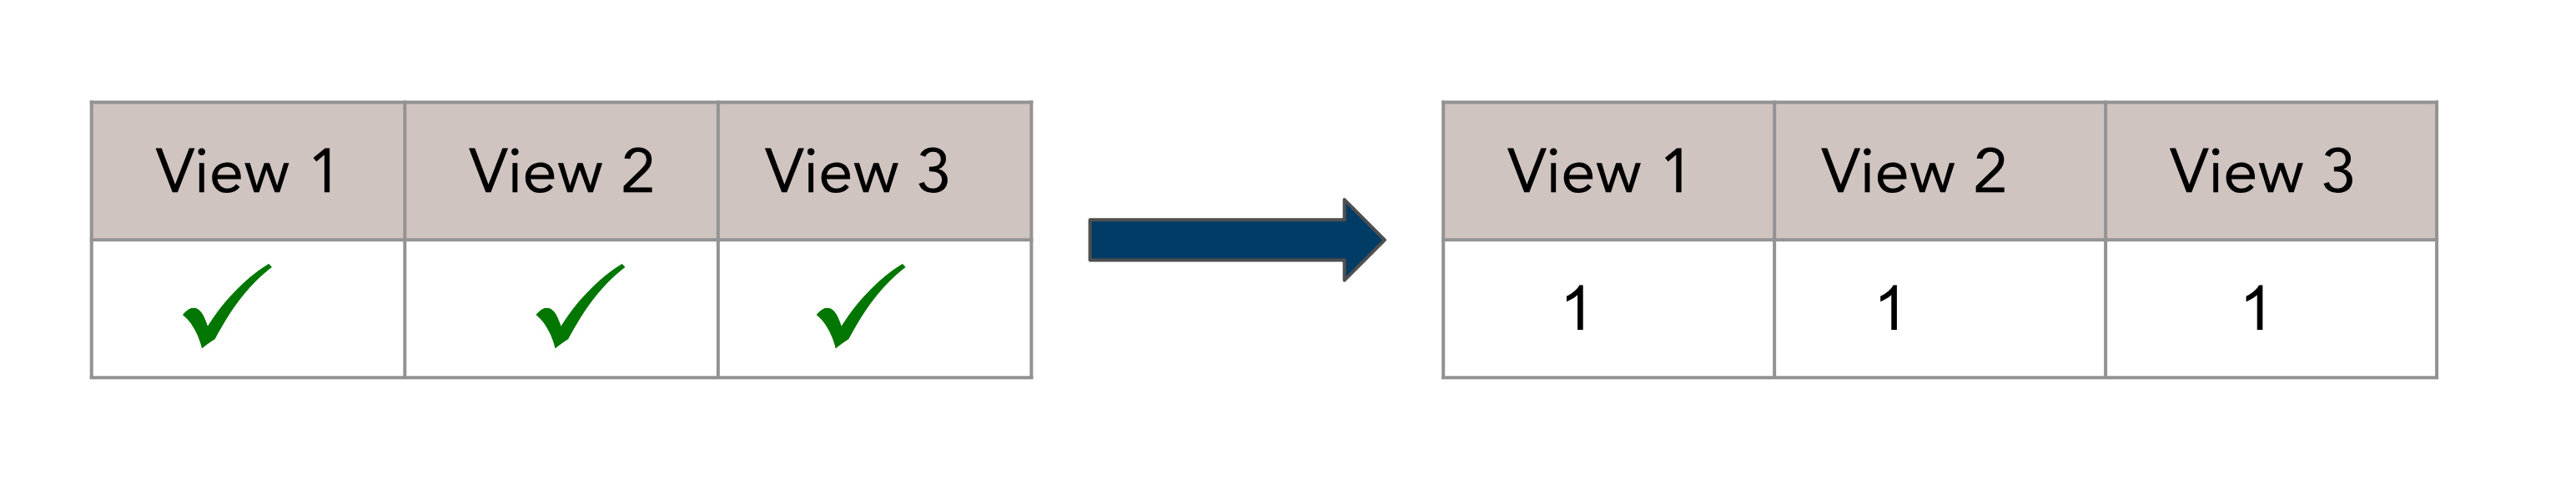
Since continuous views are a lot like regular views, when we need to retrieve the results from them we can just run SELECT on specific view:
SELECT link_text AS FROM link_text_count;
| link_text | count |
|---|---|
| "Like" | 3 |
| "Sign Up" | 5 |
| "Sign In" | 0 |
We can use any SELECT statement to further analyze data in the continuous view.
Grafana
To give more power to a developer's data exploration, Chronos uses Grafana to visualize queries in each of our databases. Though the developer has to manually link Grafana to each of the databases via Grafana's GUI, the process of doing so is quite easy (and we explain how to do so in our repository's README file). Once done, a developer can use either Grafana's query builder (GUI) or SQL to query the databases in order to visualize the data.

Example of pageviews from a particular user over an hour
Future Plans
Cold Storage
Currently, Chronos does not take any actions for moving data out of TimescaleDB to some other storage option. This is problematic because TimescaleDB is not meant to be a data dump a la HDFS, and as such it starts to experience significant performance loss between 50 to 100TB of data.
As such, we would like TimescaleDB to only hold on to data that is 30 days old. Anything older could be taken out of TimescaleDB and either stored elsewhere. This would not only limit the amount of data in TimescaleDB so that it could still be performant, but also retain data so it could be sent to a proprietary solution later on when the application has outgrown Chronos.
More Event Tracking and SPA Support
While Chronos currently supports more automated event tracking than the other solutions in our use case space, there are many more we can add. In relation to this, we would also like to improve the data models of our events as well to provide as much robust information as possible.
However, even more critical is to develop support for Single Page Applications (SPA). Chronos currently only supports "traditional" applications, or where the application loads an HTML document for reach page. More and more applications are rather using AJAX requests in order to populate the content of their pages, and as such we want Chronos to be able to work with them.
Scalability and Distribution
Currently Chronos operates on a single node. One of our goals is to be able to scale Chronos horizontally on various nodes while still abstracting any difficulties for the developer in setting this up.
Implement Automatic Kafka Management
While the Chronos CLI makes it easy to reboot individual Kafka containers, we would like to have a more automated process that responds to errors as they occur and takes the necessary steps to fix the issues as well as report any details to the developer. This would go a long way in the difficulties of managing Kafka for the developer and allow attention to be focused on the application and not Chronos.
About Us
The team behind Chronos consists of two full-stack software engineers who collaborated remotely within the united states: Nick Calibey and Alexandra Prodan. Please feel free to reach out to us with any questions about Chronos or if you'd like to just discuss any of the topics covered here!
References
Please head over to our Bibliography for a complete listing of resources we used to research and build Chronos.
[1] Keen IO, Build vs. Buy Gets Easier with APIs: A CTO's Guide to Getting Data Strategy Right, 3.
[2] Michelle Wetzler, “Event Data vs Entity Data — How to store user properties in Keen IO,”. Keen developed this model from certain distinctions made by Ben Johnson in his talk “Behavioral Databases: Next Generation NoSQL Analytics.” See also Taylor Barnett, “(Event) Data is Everywhere,”.
[3] Tyler Akidau, Slava Chernyak, & Reuven Lax, Streaming Systems: The What, Where, When, and How of Large-Scale Data Processing (Sebastopol, CA: O'Reilly Media, 2018).
[4] Mike Freedman, "Time-series data: Why (and how) to use a relational database instead of NoSQL,".
[5] Jordan Baker, "SQL or NoSQL, That Is the Question".